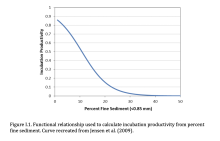
Percent Fine Sediment and Incubation Productivity
stobias
View all records in the stressor response library
Species Common Name
general salmonid
Stressor Name
Sedimentation
Specific Stressor Metric
Fine Sediment
Stressor Units
%
Life Stage
Activity
incubation
Detailed SR Function Description
The functional relationship used to calculate incubation productivity from percent fine sediment. Curve recreated from Jensen et al. (2009).
Jensen et al. (2009) summarized published values of incubation productivity for four salmonid species (Chinook, coho, chum, and steelhead) and created a logistic model to relate percent fines to percent incubation productivity. Jensen et al. (2009) presented data for all four salmonid species, but there was significant overlap among species and there appeared to be little justification for using different functional relationships for each species. Therefore, this function uses estimates for an all-species relationship.
Jensen et al. (2009) summarized published values of incubation productivity for four salmonid species (Chinook, coho, chum, and steelhead) and created a logistic model to relate percent fines to percent incubation productivity. Jensen et al. (2009) presented data for all four salmonid species, but there was significant overlap among species and there appeared to be little justification for using different functional relationships for each species. Therefore, this function uses estimates for an all-species relationship.
Function Type
continuous
Stressor Scale
linear
Citation(s)
Beechie, T. J., C. Nicol, C. Fogel, J. Jorgensen, J. Thompson, G. Seixas, J. Chamberlin, J. Hall, B. Timpane-Padgham, P. Kiffney, S. Kubo, and J. Keaton. 2021. Modeling Effects of Habitat Change and Restoration Alternatives on Salmon in the Chehalis River Basin Using a Salmonid Life-Cycle Model. U.S. Department of Commerce, NOAA Contract Report NMFS-NWFSC-CR-2021-01.
Citation Link
File Upload
Excel file showing formula for graphing curve
(299 bytes)
Stressor Response csv data
sr_curve (20).csv
(299 bytes)
| Stressor (X) | Mean System Capacity (%) | SD | low.limit | up.limit |
|---|---|---|---|---|
| 0 | 0.879637302 | 0 | 0 | 0 |
| 5 | 0.743454208 | 0 | 0 | 0 |
| 10 | 0.534694157 | 0 | 0 | 0 |
| 15 | 0.313028192 | 0 | 0 | 0 |
| 20 | 0.153034056 | 0 | 0 | 0 |
| 25 | 0.066857153 | 0 | 0 | 0 |
| 30 | 0.027625547 | 0 | 0 | 0 |
| 35 | 0.011140116 | 0 | 0 | 0 |
| 40 | 0.004447304 | 0 | 0 | 0 |
| 45 | 0.001768241 | 0 | 0 | 0 |
| 50 | 0.000701912 | 0 | 0 | 0 |
Stressor Response Chart

