Temperature and Chinook Prespawn
mbayly
View all records in the stressor response library
Species Common Name
spring Chinook Salmon
Latin Name (Genus species)
Oncorhynchus
species (latin)
tshawytscha
Stressor Name
Temperature
Specific Stressor Metric
7-DADM
Stressor Units
C
Vital Rate (Process)
Survivorship
Geography
Willamette River, OR
Key Covariates and Dependencies
Slope
Bankfull Width
Detailed SR Function Description
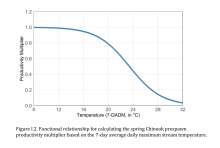
Density-independent survivorship for spring Chinook upstream migration and holding and stream temperature. Stream temperature is modelled as the 7-day average of daily maximum (7-DADM). Functional relationship is originally sourced from the Willamette River OR (see original source data from (Bowerman et al. 2018).
Regression line shows relationship for wild (non-hatchery) origin fish. Mortality increases with stream temperature
Regression line shows relationship for wild (non-hatchery) origin fish. Mortality increases with stream temperature
Stressor Magnitude Data
Empirical model that estimates fine sediment from road density, slope and bankfull width
PoE Chain
Upland development, road building, fine sediment, smothering of eggs, egg to fry surviorship
Function Type
continuous
Stressor Scale
linear
Citation(s)
Beechie, T. J., C. Nicol, C. Fogel, J. Jorgensen, J. Thompson, G. Seixas, J. Chamberlin, J. Hall, B. Timpane-Padgham, P. Kiffney, S. Kubo, and J. Keaton. 2021. Modeling Effects of Habitat Change and Restoration Alternatives on Salmon in the Chehalis River Basin Using a Salmonid Life-Cycle Model. U.S. Department of Commerce, NOAA Contract Report NMFS-NWFSC-CR-2021-01
Citation Link
Stressor Response csv data
7dadm.csv
(357 bytes)
| Stressor (X) | Mean System Capacity (%) | SD | low.limit | up.limit |
|---|---|---|---|---|
| 8 | 99.74 | 0 | 99.74 | 99.74 |
| 10 | 99.44 | 0 | 99.44 | 99.44 |
| 12 | 98.8 | 0 | 98.8 | 98.8 |
| 14 | 97.43 | 0 | 97.43 | 97.43 |
| 16 | 94.59 | 0 | 94.59 | 94.59 |
| 18 | 88.96 | 0 | 88.96 | 88.96 |
| 20 | 78.8 | 0 | 78.8 | 78.8 |
| 22 | 63.16 | 0 | 63.16 | 63.16 |
| 24 | 44.15 | 0 | 44.15 | 44.15 |
| 26 | 26.72 | 0 | 26.72 | 26.72 |
| 28 | 14.39 | 0 | 14.39 | 14.39 |
| 30 | 7.2 | 0 | 7.2 | 7.2 |
| 32 | 3.45 | 0 | 3.45 | 3.45 |
Stressor Response Chart

