Tapple and Bjornn 1983: Fines and Chinook Embryo
stobias
View all records in the stressor response library
Species Common Name
Chinook Salmon
Latin Name (Genus species)
Oncorhynchus tshawytscha
Stressor Name
Sedimentation
Specific Stressor Metric
Substrate particles
Stressor Units
% smaller than 6.35mm
Life Stage
Geography
Idaho and Washington Streams
Detailed SR Function Description
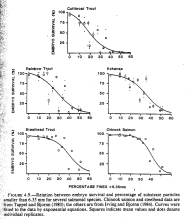
[Taken from figure caption] Relation between embryo survival and percentage of substrate particles smaller than 6.35mm for chinook salmon.
[Taken from paper] Redds that remain intact during incubation may become less suitable for embryos if inorganic fine sediments and organic materials are deposited in the interstitial spaces between the larger particles. The fine particles impeded the movement of water and alevins in the redd, and the organic material consumes oxygen during decomposition; if the oxygen is consumed faster than the reduced intragravel water flow can replace it, the embryos or alevins will asphyxiate.
Keywords: Fines. Fine substrate. Sedimentation
Function Derivation
field study
Function Type
continuous
Stressor Scale
linear
References Cited
Bjornn, T. C., & Reiser, D. W. (1991). Habitat requirements of salmonids in streams. American Fisheries Society Special Publication, 19(837), 99.
Tappel, P. D., & Bjornn, T. C. (1983). A new method of relating size of spawning gravel to salmonid embryo survival. North American Journal of Fisheries Management, 3(2).
Tappel, P. D., & Bjornn, T. C. (1983). A new method of relating size of spawning gravel to salmonid embryo survival. North American Journal of Fisheries Management, 3(2).
Stressor Response csv data
sr_curve (4).csv
(763 bytes)
| Stressor (X) | Mean System Capacity (%) | SD | low.limit | up.limit |
|---|---|---|---|---|
| 0.00 | 97.13 | 0.00 | 97.13 | 97.13 |
| 2.74 | 97.45 | 0.00 | 97.45 | 97.45 |
| 6.86 | 97.45 | 0.00 | 97.45 | 97.45 |
| 12.10 | 97.45 | 0.00 | 97.45 | 97.45 |
| 15.09 | 96.82 | 0.00 | 96.82 | 96.82 |
| 18.59 | 95.86 | 0.00 | 95.86 | 95.86 |
| 21.95 | 94.27 | 0.00 | 94.27 | 94.27 |
| 25.57 | 91.08 | 0.00 | 91.08 | 91.08 |
| 28.94 | 85.99 | 0.00 | 85.99 | 85.99 |
| 31.31 | 81.21 | 0.00 | 81.21 | 81.21 |
| 33.43 | 75.16 | 0.00 | 75.16 | 75.16 |
| 35.18 | 69.75 | 0.00 | 69.75 | 69.75 |
| 36.80 | 64.01 | 0.00 | 64.01 | 64.01 |
| 38.79 | 55.41 | 0.00 | 55.41 | 55.41 |
| 40.17 | 48.41 | 0.00 | 48.41 | 48.41 |
| 42.29 | 39.49 | 0.00 | 39.49 | 39.49 |
| 44.91 | 29.30 | 0.00 | 29.30 | 29.30 |
| 48.02 | 18.47 | 0.00 | 18.47 | 18.47 |
| 50.64 | 12.10 | 0.00 | 12.10 | 12.10 |
| 53.51 | 7.01 | 0.00 | 7.01 | 7.01 |
| 56.26 | 3.82 | 0.00 | 3.82 | 3.82 |
| 58.25 | 2.87 | 0.00 | 2.87 | 2.87 |
| 59.88 | 2.55 | 0.00 | 2.55 | 2.55 |
| 59.88 | 2.55 | 0.00 | 2.55 | 2.55 |
Stressor Response Chart
Mean Response
±1 Standard Deviation
Upper/Lower Limits

