Impervious Area and Coho Salmon Prespawn Survivorship
stobias
View all records in the stressor response library
Species Common Name
Coho Salmon
Latin Name (Genus species)
Oncorhynchus kisutch
Stressor Name
Area
Specific Stressor Metric
Impervious Area
Stressor Units
%
Vital Rate (Process)
survivorship
Life Stage
Detailed SR Function Description
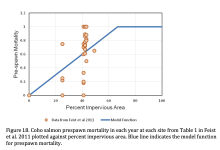
The graph shows Coho salmon prespawn survivorship in each year at each site from Table 1 in Feist et al. 2011 plotted against percent impervious area. Blue line indicates the model function for prespawn survivorship.
The original graph from Beechie et al shows pre-spawn mortality, this graph was invested to show prespawn survivorship instead.
Prespawn mortality in coho salmon is correlated with a number of metrics indicating level of development (e.g., road density, percent impervious area) (Feist et al. 2011, 2017). The most straightforward function appears to be a linear relationship between prespawn mortality and percent impervious area (Figure 2a in Feist et al. 2011).
We plotted the pre-spawn survival in individual years for each site. The data are fitted well with a function of:
Percent impervious area ≤66.67%: Prespawn mortality = (0.015) × (% imp. area)
Percent impervious area >66.67%: Prespawn mortality = 1.0.
Function Derivation
expert opinion
Function Type
continuous
Stressor Scale
linear
References Cited
Beechie, T. J., C. Nicol, C. Fogel, J. Jorgensen, J. Thompson, G. Seixas, J. Chamberlin, J. Hall, B. Timpane-Padgham, P. Kiffney, S. Kubo, and J. Keaton. 2021. Modeling Effects of Habitat Change and Restoration Alternatives on Salmon in the Chehalis River Basin Using a Salmonid Life-Cycle Model. U.S. Department of Commerce, NOAA Contract Report NMFS-NWFSC-CR-2021-01.
Feist, B. E., E. R. Buhle, P. Arnold. J. W. Davis, and N. L. Scholz. 2011. Landscape ecotoxicology of coho salmon spawner mortality in urban streams. PLoS ONE 6(8):e23424, doi:10.1371/journal.pone.0023424
Feist, B. E., E. R. Buhle, P. Arnold. J. W. Davis, and N. L. Scholz. 2011. Landscape ecotoxicology of coho salmon spawner mortality in urban streams. PLoS ONE 6(8):e23424, doi:10.1371/journal.pone.0023424
Citation Link
File Upload
Stressor Response csv data
I.8 Impervious Area and Prespawn survivorship.csv
(102 bytes)
| Stressor (X) | Mean System Capacity (%) | SD | low.limit | up.limit |
|---|---|---|---|---|
| 0 | 100 | 0 | 0 | 0 |
| 66.67 | 100 | 0 | 0 | 0 |
| 100 | 0 | 0 | 0 | 0 |
Stressor Response Chart

