Calcite and Westslope Cutthroat Trout Spawning Suitability
stobias
View all records in the stressor response library
Species Common Name
Westslope Cutthroat Trout
Latin Name (Genus species)
Oncorhynchus clarkii lewisi
Stressor Name
Calcite
Stressor Units
Calcite concrection
Vital Rate (Process)
Capacity
Geography
Elk River, BC
Detailed SR Function Description
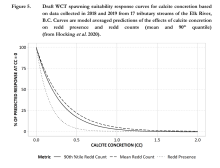
Draft WCT spawning suitability response curves for calcite concretion based on data collected in 2018 and 2019 from 17 tributary streams of the Elk River, B.C. Curves are model-averaged predictions of the effects of calcite concretion on redd presence and redd counts.
The influence of calcite concretion on the response variables was negative, and the suitability model for WCT decreases exponentially with increasing levels of calcite concretion.
The influence of calcite concretion on the response variables was negative, and the suitability model for WCT decreases exponentially with increasing levels of calcite concretion.
Function Derivation
expert opinion
Function Type
continuous
Stressor Scale
linear
References Cited
Hocking, M., Tamminga, A., Arnett, T., Robinson, M., Larratt, H., & Hatfield, T. (2021). Subject Matter Expert Report: Calcite. Evaluation of Cause–Decline in Upper Fording River Westslope Cutthroat Trout Population. Report prepared for Teck Coal Ltd. by Ecofish Research Ltd., Lotic Environmental Ltd., and Larratt Aquatic Consulting Ltd.
Citation Link
Stressor Response csv data
Hocking Fig 5.csv
(724 bytes)
| Stressor (X) | Mean System Capacity (%) | SD | low.limit | up.limit |
|---|---|---|---|---|
| 0.00 | 100.00 | 0.00 | 100.00 | 100.00 |
| 0.05 | 86.52 | 0.00 | 86.52 | 86.52 |
| 0.07 | 80.00 | 0.00 | 80.00 | 80.00 |
| 0.10 | 71.30 | 0.00 | 71.30 | 71.30 |
| 0.13 | 63.04 | 0.00 | 63.04 | 63.04 |
| 0.18 | 54.35 | 0.00 | 54.35 | 54.35 |
| 0.22 | 46.96 | 0.00 | 46.96 | 46.96 |
| 0.27 | 39.57 | 0.00 | 39.57 | 39.57 |
| 0.35 | 30.00 | 0.00 | 30.00 | 30.00 |
| 0.43 | 22.17 | 0.00 | 22.17 | 22.17 |
| 0.53 | 15.65 | 0.00 | 15.65 | 15.65 |
| 0.63 | 11.30 | 0.00 | 11.30 | 11.30 |
| 0.72 | 8.26 | 0.00 | 8.26 | 8.26 |
| 0.81 | 5.65 | 0.00 | 5.65 | 5.65 |
| 0.90 | 4.35 | 0.00 | 4.35 | 4.35 |
| 1.00 | 2.61 | 0.00 | 2.61 | 2.61 |
| 1.10 | 1.74 | 0.00 | 1.74 | 1.74 |
| 1.22 | 0.87 | 0.00 | 0.87 | 0.87 |
| 1.32 | 0.43 | 0.00 | 0.43 | 0.43 |
| 1.43 | 0.43 | 0.00 | 0.43 | 0.43 |
| 1.53 | 0.00 | 0.00 | 0.00 | 0.00 |
| 1.64 | 0.00 | 0.00 | 0.00 | 0.00 |
| 1.75 | 0.00 | 0.00 | 0.00 | 0.00 |
| 2.00 | 0.00 | 0.00 | 0.00 | 0.00 |
Stressor Response Chart
Mean Response
±1 Standard Deviation
Upper/Lower Limits

