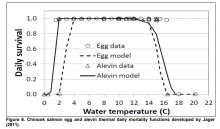
Jager 2011: Chinook Salmon Eggs and Temperature
mbayly
View all records in the stressor response library
Species Common Name
Chinook Salmon
Latin Name (Genus species)
Oncorhynchus tshawytscha
Stressor Name
Temperature
Specific Stressor Metric
Incubation Temperature
Stressor Units
°C
Vital Rate (Process)
Survival
Geography
Laboratory Experiment
Detailed SR Function Description
Directly quoted from Bratovich et al 2020:
"Jager (2011) reviewed and compiled mortality and exposure duration data from constanttemperature laboratory studies for Chinook salmon eggs (fertilization to hatching) and alevins(hatching to emergence). For each study, Jager (2011) standardized the survival data by dividingby the maximum survival over all temperature treatments for each study. If the study did not reportthe duration of the two lifestages, a temperature relationship was fitted to the lifestage to estimateduration.
Studies incorporated for the fertilized egg relationship included Murray and McPhail (1988),Combs and Burrows (1957), Garling and Masterson (1985), Beacham and Murray (1989), Jensenand Groot (1991), and Heming (1982). Due to lack of duration data, exposure durations wereestimated for fertilized eggs for the Combs and Burrows (1957) data. Studies used in the alevinrelationship included Murray and McPhail (1988), Garling and Masterson (1985), Beacham andMurray (1989), and Jensen and Groot (1991). Due to a reported lack of lifestage duration data,durations were estimated for alevins for the Garling and Masterson (1985) and Jensen and Groot(1991) data. For studies where replicate treatments were conducted, survival rates from thereplicates were averaged (using a weighted average based on starting number of eggs or alevin)together for each water temperature treatment.
Based on these data, Jager (2011) developed a model relating daily survival of Chinook salmonfertilized eggs and alevins to water temperature using a double Weibull model (Figure 6). Theright-hand side of the function for eggs (i.e., at 0% daily survival) is driven by two data pointsfrom Jensen and Groot (1991). These two data points were excluded from the Water Forumfertilized egg function development (this TM) because mortality reached 100% prior to 50% hatch,and duration to mortality was not reported. In addition, although mortality reached 100% prior to50% hatch, it is unlikely that the daily survival rate was actually 0%, particularly for the 64.4°Ftreatment. Although the equation to calculate daily survival based on cumulative survival andduration will result in a 0% daily survival rate, results from other laboratory studies (Seymour1956 and USFWS 1999) that exposed fertilized eggs to water temperatures of 64-64.6°F indicate that daily mortality rates ranged from 2.8% to 15%. In addition, short-term thermal exposure (“heat shock”) experiments found that mortality rates of Chinook salmon cleavage egg and embryo lifestages exposed to 22°C (71.6°F) for 8 hours were 10% and 3%, respectively (Neitzel and Becker 1985).
Similar to the fertilized egg function, the right-hand side of the pre-emergent fry (“alevin”)function is driven by only one data point, also from Jensen and Groot (1991), for the 61.5°Ftreatment. This data point also was excluded from the Water Forum alevin function (this TM) dueto concern over the inconsistency in the duration from 50% hatch to emergence for this temperaturetreatment relative to other treatments. Although Jager (2011) calculated the exposure durationbased on water temperature, it is unlikely that, despite the cumulative survival of 0%, that the dailysurvival rate was 0% (i.e., all alevins perished in one day) at 61.5°F, in consideration of the otherwater temperature studies. For example, daily alevin mortality rates of Sacramento River fall-runand winter-run Chinook salmon associated with exposure to 62°F across 8 replicates ranged from2.4% to 20.6% (USFWS 1999).."
Function Derivation
Manual
Transferability of Function
Very limited. Especially on the cold (right-hand side).
Source of stressor Data
Lab studies
Function Type
continuous
Stressor Scale
linear
References Cited
Bratovich, P., M. Neal, A. Ransom, P. Bedore, and M. Bryan. 2020. Chinook Salmon Early Lifestage
Survival & Folsom Dam Power Bypass Considerations. Prepared for the Sacramento Water Forum.
September 2020.
Jager, H. I. 2011. Quantifying Temperature Effects on Fall Chinook Salmon. ORNL/TM2011/456.
Survival & Folsom Dam Power Bypass Considerations. Prepared for the Sacramento Water Forum.
September 2020.
Jager, H. I. 2011. Quantifying Temperature Effects on Fall Chinook Salmon. ORNL/TM2011/456.
Citation Link
Stressor Response csv data
jeager_2011.csv
(544 bytes)
| Stressor (X) | Mean System Capacity (%) | SD | low.limit | up.limit |
|---|---|---|---|---|
| 0 | 0 | 0 | 0 | 100 |
| 1.37 | 0 | 0 | 0 | 100 |
| 1.86 | 0.55 | 0 | 0 | 100 |
| 2.16 | 6.99 | 0 | 0 | 100 |
| 2.3 | 21.34 | 0 | 0 | 100 |
| 2.5 | 37.18 | 0 | 0 | 100 |
| 2.89 | 53.03 | 0 | 0 | 100 |
| 3.23 | 69.36 | 0 | 0 | 100 |
| 3.67 | 87.68 | 0 | 0 | 100 |
| 3.72 | 100 | 0 | 0 | 100 |
| 4.02 | 100 | 0 | 0 | 100 |
| 6.66 | 100 | 0 | 0 | 100 |
| 7.45 | 100 | 0 | 0 | 100 |
| 8.53 | 100 | 0 | 0 | 100 |
| 10.93 | 100 | 0 | 0 | 100 |
| 11.81 | 100 | 0 | 0 | 100 |
| 13.28 | 100 | 0 | 0 | 100 |
| 13.96 | 94.11 | 0 | 0 | 100 |
| 15.04 | 57.48 | 0 | 0 | 100 |
| 15.39 | 30.25 | 0 | 0 | 100 |
| 15.92 | 13.42 | 0 | 0 | 100 |
| 16.37 | 1.05 | 0 | 0 | 100 |
| 16.81 | 0 | 0 | 0 | 100 |
| 18.03 | 0 | 0 | 0 | 100 |
| 19.6 | 0 | 0 | 0 | 100 |
| 20.29 | 0 | 0 | 0 | 100 |
Stressor Response Chart
Mean Response
±1 Standard Deviation
Upper/Lower Limits

