Temperature and Salish Sucker System Capacity
mbakken
View all records in the stressor response library


Species Common Name
Salish Sucker
Latin Name (Genus species)
Catostomus sp.
Stressor Name
Water Temperature
Stressor Units
°C
Vital Rate (Process)
CPUE
Geography
Lower Fraser Valley (British Columbia)
Detailed SR Function Description
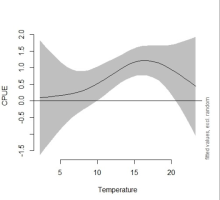
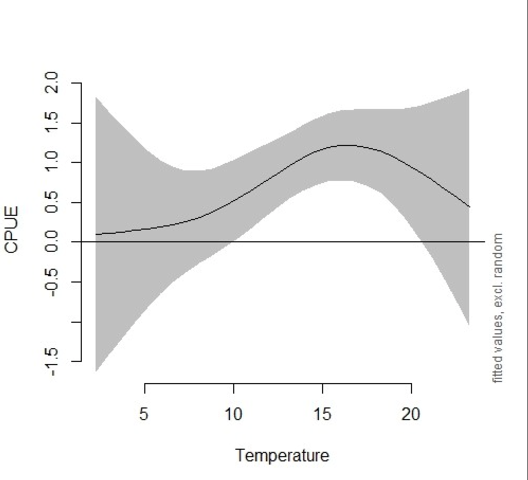
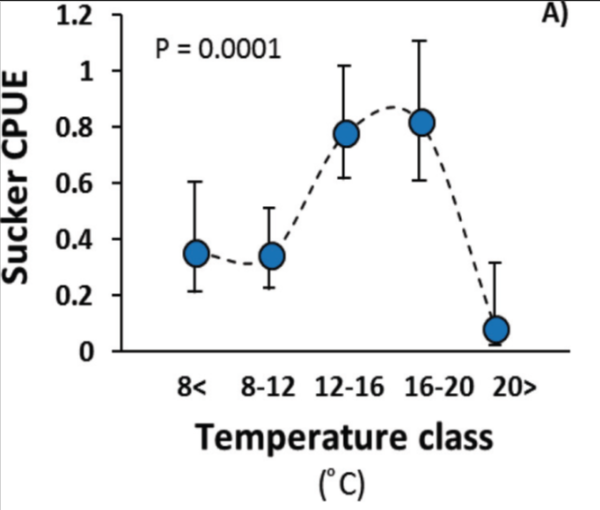
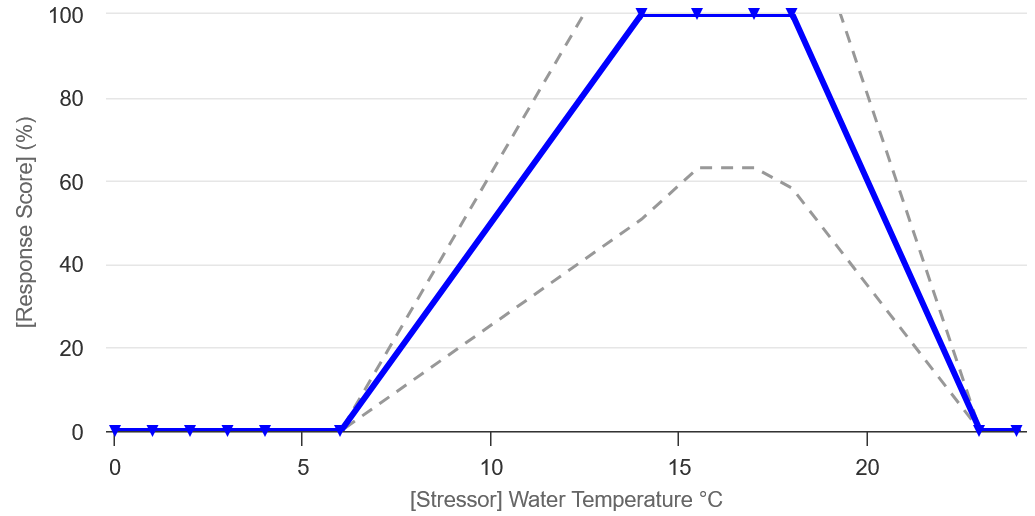
Three data sources of information were considered for deriving the final curve i.e., Pearson (2004), Rosenfeld et al. (2021) and Edwards (1983). In addition, we considered the expert opinion provided at the workshop conducted in November 2024. Maximum system capacity was defined by standardizing data to the highest value for CPUE (fish trap-1). It should be noted that Salish sucker are thought to be somewhat more warm-adapted than Longnose sucker, which are much more widely distributed and considered to be a cool-water species; temperature data for Salish sucker appears to support this inference, since the temperature curve foe Salish sucker appears right-shifted to higher temperatures relative to Longnose sucker. The final curve was derived by fitting a Generalized Additive Model (GAM) to original CPUE data from Rosenfeld et al. (2021). The fitted GAM curve was marginally significant (p<0.1) with wide confidence intervals at the high and low temperature extremes, which is likely due to fewer data points at very low and high temperatures. However, we can be fairly confident that the confidence intervals are in fact likely low at very high and low temperatures, despite the wide intervals implied by the GAM. This is apparent in the narrower confidence intervals in the CPUE-temperature function fit to temperature classes in Rosenfeld et al. (2021; see Fig. 2 below). The lower and upper x-intercepts in the final function (temperature at which system capacity is 0, i.e., 6oC and 23oC respectively) were determined based on the upper and lower temperatures where fish were caught in traps (see supporting SR function Excel file, cells AK157 and AK 171). The habitat suitability index model for Longnose Sucker (Edwards 1983) provided additional supportive evidence for the shape of the function, as did superimposition of Pearson (2004) data on top of the CPUE-temperature SR function. The function was further modified based on input received at the expert workshop i.e. the response to temperature should be a step faction and therefore, the maximum system capacity (100%) should be a plateau rather than a peak. The temperature range of the plateau was chosen as 14 to 18°C (Sierra Sullivan and Mike Pearson, Pers. Comm., 2024).
Function Derivation
Based on data from Salish Sucker, supported by data from Longnose Sucker; Empirical data (correlative model); Published; Expert opinion
Transferability of Function
As local adaptations are likely minimal among different Salish Sucker populations, we would not expect much variation in true tolerance among populations. This function should therefore be broadly applicable to all populations of the species, with the caveat that it is partly based on data from longnose sucker.
Source of stressor Data
This is largely to be determined, but it will likely be a combination of data from Rosenfeld et al. (2021), data collected by Samantha Ramirez (2024) as part of her M.Sc. thesis, and a database of current and future projections produced by Dr. Iacarella with DFO and collaborators (currently unpublished, but see (Weller et al. (2023).
Function Type
continuous
Stressor Scale
linear
References Cited
Usoof, A.M. and Rosenfeld, J.S. 2024. Relationship between system capacity and mean water temperature for Salish Sucker.
Edwards, E. A. 1983. Habitat Suitability Index Models: Longnose Sucker. U.S. Dept. Int., FishWildl. Serv. FWS/OBS-82/10.35.
Pearson, M. P. 2004. The ecology, status and recovery prospects of Noonsack Dace (Rhinichthys Cataractae ssp.) and Salish Sucker (Catostomus sp.) in Canada. PhD Thesis. University of British Columbia.
Ramirez, S. Z. 2024. Modelling the impact of human development and water quality on hypoxia. MSc Thesis. University of British Columbia.
Rosenfeld, J., M. P. Pearson, J. Miners, and K. Zinn. 2021. Effects of landscape-scale hypoxia on Salish sucker and salmonid habitat associations : implications for endangered 1233:1219–1233.
Weller, J. D., R. D. D. Moore, J. C. Iacarella, J. D. Weller, R. D. D. Moore, J. C. I. Nov, and J. D. Weller. 2023. Thermalscape scenarios for British Columbia , Canada. Canadian Water Resources Journal / Revue canadienne des ressources hydriques.
File Upload
Images
Stressor Response csv data
Data_SS_Temperature.csv
(402 bytes)
| Temperature (˚C) | Mean System Capacity (%) | SD | low.limit | up.limit |
|---|---|---|---|---|
| 0.00 | 0.00 | 0.00 | 0.00 | 0.00 |
| 1.00 | 0.00 | 0.00 | 0.00 | 0.00 |
| 2.00 | 0.00 | 0.00 | 0.00 | 0.00 |
| 3.00 | 0.00 | 0.00 | 0.00 | 0.00 |
| 4.00 | 0.00 | 0.00 | 0.00 | 0.00 |
| 6.00 | 0.00 | 0.00 | 0.00 | 0.00 |
| 14.00 | 100.00 | 0.00 | 50.82 | 123.77 |
| 15.50 | 100.00 | 0.00 | 63.11 | 132.79 |
| 17.00 | 100.00 | 0.00 | 63.11 | 134.43 |
| 18.00 | 100.00 | 0.00 | 58.20 | 134.43 |
| 23.00 | 0.00 | 0.00 | 0.00 | 0.00 |
| 24.00 | 0.00 | 0.00 | 0.00 | 0.00 |
Stressor Response Chart
Mean Response
±1 Standard Deviation
Upper/Lower Limits