Angling Effort and Bull Trout
mbakken
View all records in the stressor response library

Species Common Name
Bull Trout
Latin Name (Genus species)
Salvelinus confluentus
Stressor Name
Angling effort
Specific Stressor Metric
Angling effort (incidental angling mortality and illegal harvest)
Stressor Units
hours/km
Vital Rate (Process)
System capacity
Geography
Alberta foothills watersheds, excluding National Parks
Detailed SR Function Description
Native trout were legally harvested throughout the eastern slopes prior to the implementation of the province-wide zero harvest regulation in 1995 for Bull Trout, 2014 for Athabasca Rainbow Trout and between 2009 to 2016 period for Westslope Cutthroat Trout (note: harvest may still be permitted on stocked or heavily hybridized populations). Angling may still represent a major threat to population sustainability due to incidental mortality (i.e., mortality due to stress or physical damage from hooking or handling) associated with catch and release fishing if angling effort and catchability is high (e.g., Post et al. 2003). Illegal harvest, either intentional or due to misidentification, occurs at an unknown frequency and may also contribute to population declines. Past case studies demonstrate that some Bull Trout populations are capable of recovering relatively quickly (5-10 years) from an over-exploited state under zero harvest regulations/reduced angler effort or complete angling closures (Johnston et al. 2007; Sullivan 2014).
In the absence of information on population parameters, such as catchability and abundance, angling effort (annual rod hours per km) was used as the stressor input value. Angling effort is considered a surrogate for fishing mortality; it is assumed that there is greater mortality at high levels of effort, and lower mortality and low levels of effort. The approximated relationship between angling effort and system capacity encompasses a linear decline in system capacity with increasing angler effort until an inflection point is reached where additional effort has no further impact on system capacity. The assumption is that there is a proportion of fish in a population that are less vulnerable or invulnerable to anglers, resulting in population resiliency albeit at lower abundance, i.e., fishing mortality alone is not expected to extirpate a population. This may occur because of reduced or variable catchability due to learned hook avoidance, heterogeneity among individual fish, and environmental factors (Askey et al. 2006, Van Poorten & Post 2011). Additionally, some fish may not be caught because anglers are unable to access all areas of a river system. These inaccessible areas provide a similar function to marine protected areas by reducing the proportion of the total population available to fishing (Cox and Walters 2002).
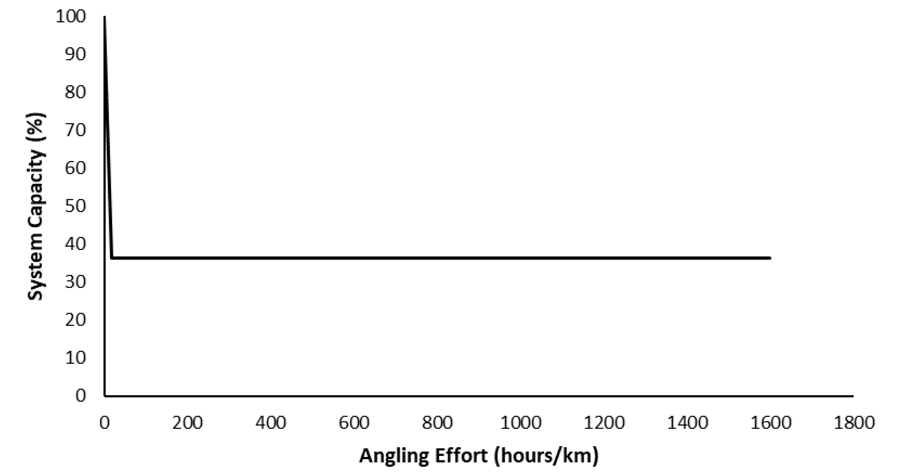
The species-specific shape of the stressor-response curve was based on a series of assumptions. First, we assumed that there was no impact to system capacity at zero angling effort (0 annual rod hours/km, 100% system capacity). Next, the x-coordinate of the inflection point was set at 18 annual rod hours/km for Bull Trout, based on Post et al. (2003) that predicted that angling effort above this value would not maintain a viable population of bull trout under catch-and-release regulations. For Westslope Cutthroat Trout this inflection point was set at 50 annual rod hours/km based on yield-per-recruit modelling that demonstrated a high potential for recruitment overfishing beyond this angling effort under catch-and-release regulations. Parameters used in this modelling exercise included a catchability coefficient of 0.015 (Sinnatamby et al. 2021) and 10% mortality due to both non-compliance and post-release mortality, similar to Post et al. (2003) (Reilly & Macpherson unpublished data). The critical angling effort value for Bull Trout is lower than Westslope Cutthroat Trout because Bull Trout exhibit life-history characteristics that make them more vulnerable to overexploitation (e.g., slow-growing, late-maturing, high catchability) (Johnston et al. 2007).
The y-coordinate of the inflection point was set as the 95th percentile of system capacity, calculated using all populations experiencing angling effort above the critical value. The 95th percentile was applied because it is expected that the relationship between system capacity and angling effort is better represented by the rate of change near the maximum response rather than the mean response, as system capacity is affected by multiple factors that may vary in their effect. This is similar logic to quantile regression that recognizes numerous unaccounted factors can be driving a response variable (Cade and Noon 2003). This produced inflection point coordinates of 18 annual rod hours/km and 36% system capacity for Bull Trout (Figure 1) and 50 annual rod hours/km and 38% system capacity for Westslope Cutthroat Trout. Species-specific fisheries models for Athabasca Rainbow Trout are not currently available. However, Westslope Cutthroat Trout and Athabasca Rainbow Trout exhibit similar life history characteristics and so the Athabasca Rainbow Trout inflection point was also set at 50 annual rod hours/km and 38% system capacity.
In the absence of information on population parameters, such as catchability and abundance, angling effort (annual rod hours per km) was used as the stressor input value. Angling effort is considered a surrogate for fishing mortality; it is assumed that there is greater mortality at high levels of effort, and lower mortality and low levels of effort. The approximated relationship between angling effort and system capacity encompasses a linear decline in system capacity with increasing angler effort until an inflection point is reached where additional effort has no further impact on system capacity. The assumption is that there is a proportion of fish in a population that are less vulnerable or invulnerable to anglers, resulting in population resiliency albeit at lower abundance, i.e., fishing mortality alone is not expected to extirpate a population. This may occur because of reduced or variable catchability due to learned hook avoidance, heterogeneity among individual fish, and environmental factors (Askey et al. 2006, Van Poorten & Post 2011). Additionally, some fish may not be caught because anglers are unable to access all areas of a river system. These inaccessible areas provide a similar function to marine protected areas by reducing the proportion of the total population available to fishing (Cox and Walters 2002).
The species-specific shape of the stressor-response curve was based on a series of assumptions. First, we assumed that there was no impact to system capacity at zero angling effort (0 annual rod hours/km, 100% system capacity). Next, the x-coordinate of the inflection point was set at 18 annual rod hours/km for Bull Trout, based on Post et al. (2003) that predicted that angling effort above this value would not maintain a viable population of bull trout under catch-and-release regulations. For Westslope Cutthroat Trout this inflection point was set at 50 annual rod hours/km based on yield-per-recruit modelling that demonstrated a high potential for recruitment overfishing beyond this angling effort under catch-and-release regulations. Parameters used in this modelling exercise included a catchability coefficient of 0.015 (Sinnatamby et al. 2021) and 10% mortality due to both non-compliance and post-release mortality, similar to Post et al. (2003) (Reilly & Macpherson unpublished data). The critical angling effort value for Bull Trout is lower than Westslope Cutthroat Trout because Bull Trout exhibit life-history characteristics that make them more vulnerable to overexploitation (e.g., slow-growing, late-maturing, high catchability) (Johnston et al. 2007).
The y-coordinate of the inflection point was set as the 95th percentile of system capacity, calculated using all populations experiencing angling effort above the critical value. The 95th percentile was applied because it is expected that the relationship between system capacity and angling effort is better represented by the rate of change near the maximum response rather than the mean response, as system capacity is affected by multiple factors that may vary in their effect. This is similar logic to quantile regression that recognizes numerous unaccounted factors can be driving a response variable (Cade and Noon 2003). This produced inflection point coordinates of 18 annual rod hours/km and 36% system capacity for Bull Trout (Figure 1) and 50 annual rod hours/km and 38% system capacity for Westslope Cutthroat Trout. Species-specific fisheries models for Athabasca Rainbow Trout are not currently available. However, Westslope Cutthroat Trout and Athabasca Rainbow Trout exhibit similar life history characteristics and so the Athabasca Rainbow Trout inflection point was also set at 50 annual rod hours/km and 38% system capacity.
Function Derivation
Expert opinion; Mechanistic theory
Transferability of Function
This function was developed and applied to Bull Trout in Alberta foothills watersheds. Parameters used to derive inflection points are specific to Bull Trout on the Alberta east slopes, so it should be applied to other species with caution.
Source of stressor Data
The amount of angler effort was summarized as annual angling hours/km. When available, creel information was used to determine angling effort. In the absence of creel data, a model that incorporated the annual temporal and spatial availability of angling opportunities for the three species of native trout was used. This was achieved by estimating the hours of angling on weekdays and weekends for relevant lengths of native trout occupied streams (km) in a watershed. This was then summarized as an annual total by accounting for the number of weeks in an angling season.
Function Type
continuous
Stressor Scale
linear
References Cited
Government of Alberta. 2024. Angling effort (incidental angling mortality and illegal harvest) stressor-response function for Athabasca Rainbow Trout, Westslope Cutthroat Trout, and Bull Trout. Environment and Protected Area Native Trout Cumulative Effects Model.
Askey, P., Richards, S. Post, J. and E. Parkinson. 2006. Linking Angling Catch Rates and Fish Learning under Catch-and-Release Regulations. North American Journal of Fisheries Management. 26. 1020-1029.
Cade, B.S. and B.R. Noon. 2003. A gentle introduction to quantile regression for ecologists. Frontiers in Ecology and the Environment 1: 412–420.
Cox. S. and C. Walters. 2002. Modeling Exploitation in Recreational Fisheries and Implications for Effort Management on British Columbia Rainbow Trout Lakes. American Journal of Fisheries Management. 22: 21-34.
Johnston, F. D., J. R. Post, C. J. Mushens, J. D. Stelfox, A. J. Paul, and B. Lajeunesse. 2007. The demography of recovery of an overexploited Bull Trout, Salvelinus confluentus, population. Canadian Journal of Fisheries and Aquatic Sciences 64:113–126.
Post, J., C. Mushens, A. Paul, and M. Sullivan. 2003. Assessment of alternative harvest regulations for sustaining recreational fisheries: model development and application to Bull Trout. North American Journal of Fisheries Management 23:22–34.
Sinnatamby, R.N., A. Cantin, and J.R. Post. 2019. Threats to at-risk salmonids of the Canadian Rocky Mountain region. Ecology of Freshwater Fish 29:477-494.
Sullivan, M. G. 2014. The Bull Trout of Jacques Lake, Jasper National Park: a population in recovery. Alberta Cooperative Conservation Research Unit, Edmonton AB. 18p.
Van Poorten, B. and Post, J. 2005. Seasonal Fishery Dynamics of a Previously Unexploited Rainbow Trout Population with Contrasts to Established Fisheries. North American Journal of Fisheries Management. 25. 329-345.
File Upload
Images
Stressor Response csv data
mydata.csv
(128 bytes)
| Angling Effort (hr/km) | Mean System Capacity (%) | SD | low.limit | up.limit |
|---|---|---|---|---|
| 0 | 100 | 0 | 0 | 1600 |
| 18 | 36.2 | 0 | 0 | 1600 |
| 1600 | 36.2 | 0 | 0 | 1600 |
Stressor Response Chart
Mean Response
±1 Standard Deviation
Upper/Lower Limits