Summer Temperature and Bull Trout
mbakken
View all records in the stressor response library

Species Common Name
Bull Trout
Latin Name (Genus species)
Salvelinus confluentus
Stressor Name
Temperature
Specific Stressor Metric
Mean August air temperature
Stressor Units
°C
Vital Rate (Process)
System capacity
Geography
Alberta foothills watersheds, excluding National Parks
Detailed SR Function Description
Each of the three native trout species are thermally sensitive and vulnerable to increased water temperature resulting from land disturbance and climate change (GOA 2023; Alberta Athabasca Rainbow Trout Recovery Team 2014; The Westslope Cutthroat Trout Recovery Team 2013).
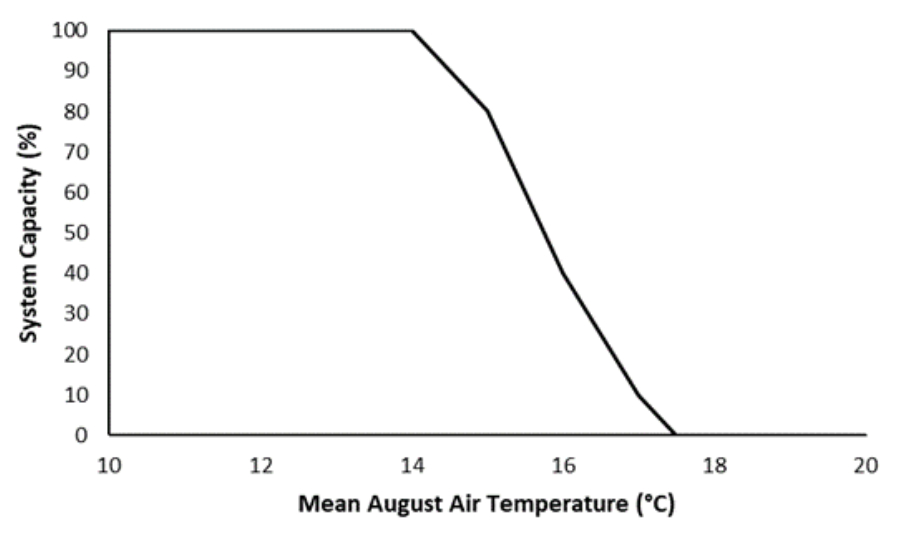
The thermal characteristics of Bull Trout habitat in Alberta were explored by comparing mean warmest month temperature (MWMT) derived using the program Climate WNA© (Hamann and Wang 2005; Wang et al. 2006) to all locations where Bull Trout have been captured between 1946–2013 (FWMIS query, Nov. 2013). Air temperature was used in this analysis because there is currently no province-wide water temperature dataset or model available. Of note, updated spatial stream network (SSN) temperature models are currently in development, but were not yet complete for use in this version of the Joe model. We expect that refinements to the stream temperature model stressor-response curves and watershed input values will occur once these models are complete. In addition, air and water temperatures are typically correlated over time scales >1 week (Mohseni et al. 1998). The minimum and maximum air temperature thresholds (10°C and 17°C; Figure 1) were similar to those reported in previous laboratory and field studies investigating the effects of water temperature on Bull Trout growth and survival (Selong et al. 2001) and occupancy (Dunham et al. 2003; Wenger et al. 2011). The findings of this analysis were used to inform the shape of the stressor-response curve below, which characterizes the expected influence of warm temperatures on the system capacity of Bull Trout populations (Figure 1).
The rapid decline in the number of occurrences of the three trout species on the colder ranges, between 10°C to 13°C for Bull Trout, 6°C to 8°C for Athabasca Rainbow Trout and 8°C to 13°C for Westslope Cutthroat Trout is likely due to sampling bias (i.e., there are fewer sampling events in cold, high-elevation areas that are difficult to access). However, in visually inspecting stream temperatures in colonized Jasper National Park streams with excellent Athabasca Rainbow Trout populations they fall within the modelled 5-8°C temperature range. Therefore, lotic habitats with these colder temperatures were still considered to be excellent Athabasca Rainbow Trout habitat and while cold temperatures undoubtedly can limit Bull Trout and Westslope Cutthroat Trout distributions, for the first iteration of this dose-response curve the results were not extended to the cold side of the curve due to lower confidence in this portion of the analysis.
Function Derivation
Empirical data; Correlative model; Landscape correlation; Published/peer-reviewed
Transferability of Function
This function was developed and applied to Bull Trout in Alberta foothills watersheds. The data comes from landscape correlation with Alberta Bull Trout streams and is supported by values in the published literature. The function is species specific but could be applied to other Bull Trout populations that are limited by high temperatures (the minimum temperature range is undefined) with caution.
Source of stressor Data
For Bull Trout, the mean August air temperature (°C) provided by ALCES Online© within the spatial unit of interest was used. Mean August air temperature (from ALCES Online©) and MWMT (from ClimateWNA) are expected to be highly correlated because the highest air temperatures in Alberta typically occur in August. Athabasca Rainbow Trout and Westslope Cutthroat Trout inputs were derived from modelled mean summer stream temperature (°C) provided by ALCES Online© within the spatial unit of interest (e.g., HUC 10 watershed).
Function Type
continuous
Stressor Scale
linear
References Cited
Government of Alberta. 2024. Temperature stressor-response function for Bull Trout. Environment and Protected Area Native Trout Cumulative Effects Model.
AARTRT - Alberta Athabasca Rainbow Trout Recovery Team. 2014. Alberta Athabasca Rainbow Trout Recovery Plan, 2014-2019. Alberta Environment and Sustainable Resources Development, Alberta Species at Risk Recovery Plan No. 36. Edmonton, AB. 111 pp.
AWCTRT - Alberta Westslope Cutthroat Trout Recovery Team. 2013. Alberta Westslope Cutthroat Trout Recovery Plan: 2012-2017. Alberta Environment and Sustainable Resources Development, Alberta Species at Risk Recovery Plan No. 28. Edmonton, AB. 77 pp.
Dunham, J., B. Rieman, and G. Chandler. 2003. Influences of temperature and environmental variables on the distribution of Bull Trout within streams at the southern margin of its range. North American Journal of Fisheries Management, 23:894-904.
Government of Alberta (GOA). 2023. Alberta Bull Trout Recovery Plan. Alberta Species at Risk Recovery Plan No. 46. Edmonton, AB. 64 pp.
Hamann, A., and T. Wang. 2005. Models of climatic normals for genecology and climate change studies in British Columbia. Agricultural and Forest Meteorology 128:211–221.
Mohseni, O., H.G. Stefan, and T.R. Erickson. 1998. A nonlinear regression model for weekly stream temperatures. Water Resources Research 34:2685-2692.
Selong, J.H., T.E. McMahon, A.V. Zale, and F.T. Barrows. 2001. Effect of temperature on growth and survival of Bull Trout, with application of an improved method for determining thermal tolerance in fishes. Transactions of the American Fisheries Society 130:1026–1037.
Wang, T., A. Hamann, D. Spittlehouse, and S.N. Aitken. 2006. Development of scale-free climate data for western Canada for use in resource management. International Journal of Climatology 26:383–397.
Wenger, S.J., D.J. Isaak, J.B. Dunham, K.D. Fausch, C.H. Luce, H.M. Neville, B.E. Rieman, M.K. Young, D.E. Nagel, D.L. Horan, and G.L. Chandler. 2011. Role of climate and invasive species in structuring trout distributions in the interior Columbia River Basin, USA. Canadian Journal of Fisheries and Aquatic Science 68: 988–1008.
File Upload
Images
Stressor Response csv data
Data_BLTR_summerTemp.csv
(246 bytes)
| Temperature (oC) | Mean System Capacity (%) | SD | low.limit | up.limit |
|---|---|---|---|---|
| 10 | 100 | 0 | 0 | 100 |
| 11 | 100 | 0 | 0 | 100 |
| 12 | 100 | 0 | 0 | 100 |
| 13 | 100 | 0 | 0 | 100 |
| 14 | 100 | 0 | 0 | 100 |
| 15 | 80 | 0 | 0 | 100 |
| 16 | 40 | 0 | 0 | 100 |
| 17 | 10 | 0 | 0 | 100 |
| 17.5 | 0 | 0 | 0 | 100 |
| 18 | 0 | 0 | 0 | 100 |
| 19 | 0 | 0 | 0 | 100 |
| 20 | 0 | 0 | 0 | 100 |
Stressor Response Chart
Mean Response
±1 Standard Deviation
Upper/Lower Limits