Mean Annual Discharge and Steelhead
mbakken
View all records in the stressor response library
Species Common Name
Steelhead
Latin Name (Genus species)
Oncorhynchus mykiss irideus
Stressor Name
Flow
Specific Stressor Metric
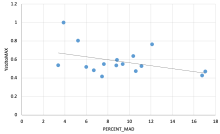
Mean Annual Discharge (MAD)
Stressor Units
%
Vital Rate (Process)
Residuals + mean (fish/m2)
Life Stage
Season
Late Summer
Geography
Salmon River, BC, Canada
Transferability of Function
Appropriate for late-summer stream flow impacts on chinook salmon juveniles and egg-to-smolt. General transferability to other chinooks stocks in unclear, but likely appropriate for other fall-spawning salmonids (i.e., regions with similar hydrology to the Lehmi River).
The relationship may be unreliable if extrapolated to a flow range outside the original data (see the Average Salmonid flow-ecology SR function entry based on Rosenfeld and Enright (2025) for a more generalizable function across a wider range of flows).
The relationship may be unreliable if extrapolated to a flow range outside the original data (see the Average Salmonid flow-ecology SR function entry based on Rosenfeld and Enright (2025) for a more generalizable function across a wider range of flows).
Function Type
continuous
Stressor Scale
linear
References Cited
Data extracted from Campbell River Water Use Plan Report
File Upload
Steelhead - MAD SR documentation
(159.8 KB)
Images

Stressor Response csv data
Data_Steelhead_Flow_Salmon_0.csv
(571 bytes)
| PERCENT_MAD | Mean System Capacity (%) | SD | low.limit | up.limit |
|---|---|---|---|---|
| 17.06464764 | 44.6259173 | 0 | 0 | 100 |
| 11.12405358 | 54.1902737 | 0 | 0 | 100 |
| 16.77344205 | 45.0947583 | 0 | 0 | 100 |
| 8.852649971 | 57.8472335 | 0 | 0 | 100 |
| 10.59988352 | 55.0341875 | 0 | 0 | 100 |
| 7.629586488 | 59.8163658 | 0 | 0 | 100 |
| 6.697728596 | 61.316657 | 0 | 0 | 100 |
| 9.376820035 | 57.0033197 | 0 | 0 | 100 |
| 3.389633081 | 66.6426907 | 0 | 0 | 100 |
| 10.36691904 | 55.4092603 | 0 | 0 | 100 |
| 5.224228305 | 63.6889924 | 0 | 0 | 100 |
| 12.11415259 | 52.5962143 | 0 | 0 | 100 |
| 3.884682586 | 65.845661 | 0 | 0 | 100 |
| 7.454863133 | 60.0976704 | 0 | 0 | 100 |
| 8.794408853 | 57.9410017 | 0 | 0 | 100 |
| 5.998835178 | 62.4418754 | 0 | 0 | 100 |
Stressor Response Chart
Mean Response
±1 Standard Deviation
Upper/Lower Limits