
Naman 2026: HSI Coho Juvenile Velocity (6°C daily net energy intake)
mbayly
View all records in the stressor response library
Species Common Name
Coho Salmon
Latin Name (Genus species)
Oncorhynchus kisutch
Stressor Name
Velocity
Specific Stressor Metric
Water Velocity (focal velocity) at 6°C
Stressor Units
m/s
Vital Rate (Process)
Habitat Suitability Index
Geography
British Columbia (composite BC invertebrate database)
Key Covariates and Dependencies
Daily water temperature at 6°C
Detailed SR Function Description
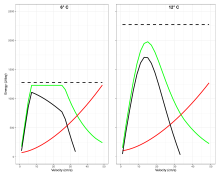
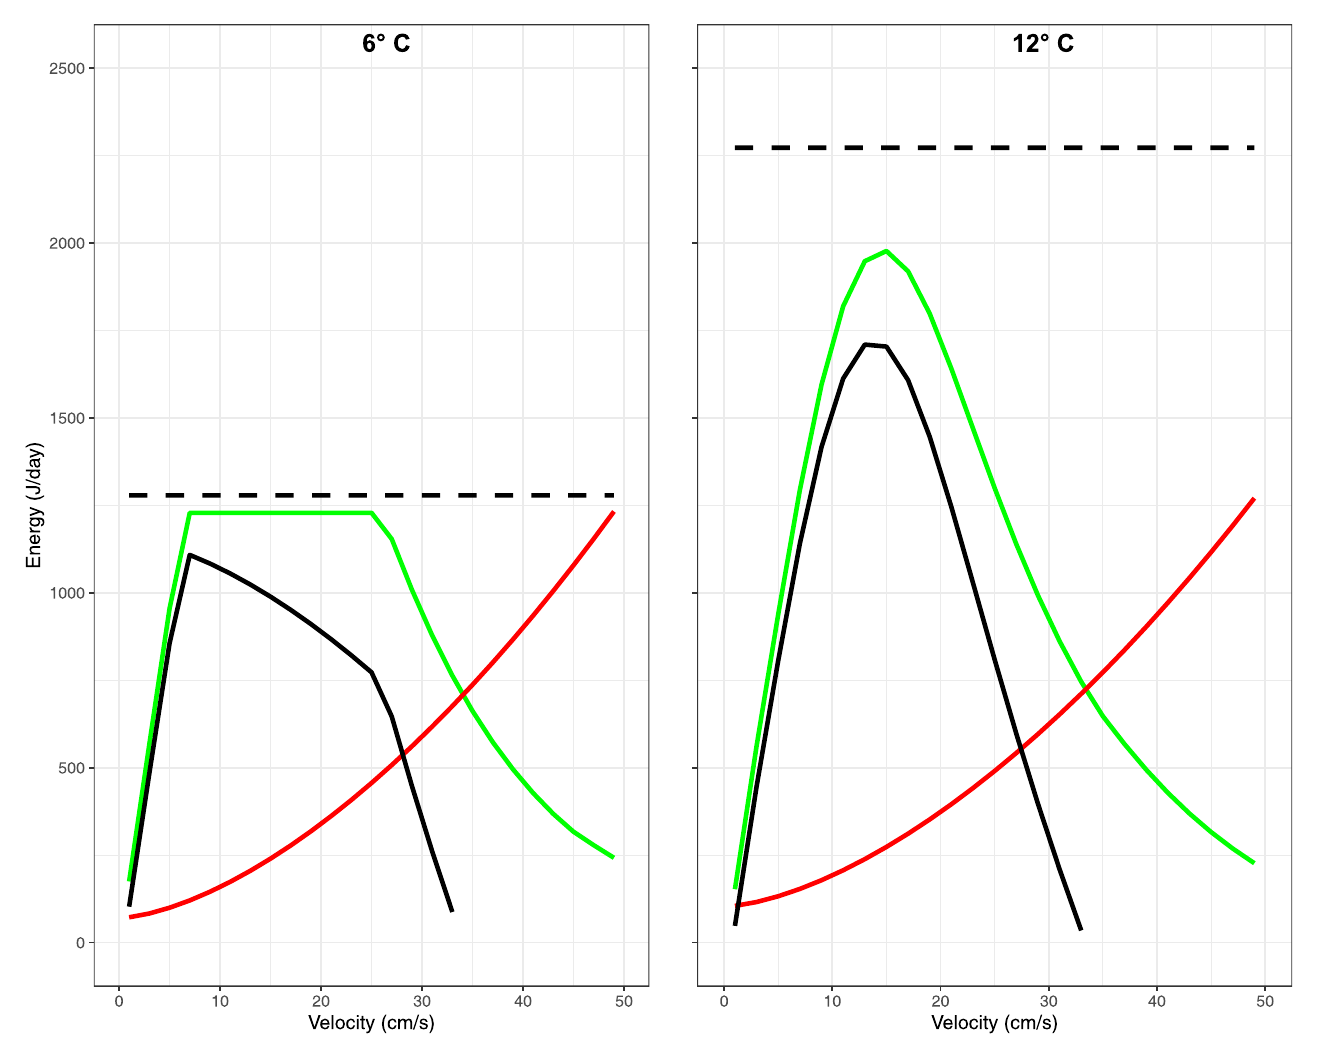
Temperature-dependent velocity suitability for a 6.5-cm, 3-g juvenile Coho Salmon, derived from the daily net energy intake (NREId, J/d; black line) predicted by a drift-foraging bioenergetic model at 6°C. NREId = daily gross energy intake (capped by temperature-dependent maximum consumption, Cmax) minus daily foraging and standard metabolic costs. Values here are scaled 0–100 relative to the maximum of this 6°C line only (peak ≈1104 J/d at ~0.07 m/s), not the global maximum across temperatures used for the paper's Figure 3 HSCs. At 6°C gross intake is constrained by Cmax, producing a plateau and a low optimal velocity. Points were taken at the plotted model vertices (0.01–0.33 m/s, every 0.02 m/s) from the figure's vector line work; a final 0 was added at 0.340 m/s by extrapolating the last segment to NREI = 0, since the paper assigns 0 suitability to negative energy intake.
Stressor-response relationship data sourced from: Figure 2 — daily net energy intake (black line) vs. velocity, 6°C panel (left) (p. 4).
See linked SR Curve for 12C:
https://mjbayly.com/stressor-response/naman-2026-hsi-coho-juvenile-velocity-12degc-daily-net-energy-intake
Stressor-response relationship data sourced from: Figure 2 — daily net energy intake (black line) vs. velocity, 6°C panel (left) (p. 4).
See linked SR Curve for 12C:
https://mjbayly.com/stressor-response/naman-2026-hsi-coho-juvenile-velocity-12degc-daily-net-energy-intake
Function Derivation
Mechanistic drift-foraging (NREI) bioenergetic model expressed on a daily time step with temperature-dependent costs and Cmax (BioenergeticHSC + Wisconsin bioenergetics).
Transferability of Function
Specific to a 6.5-cm Coho at the stated temperature and BC composite drift; conceptual worked example rather than a site-calibrated curve.
Source of stressor Data
Model output (BioenergeticHSC) using composite BC invertebrate drift data, 14 h foraging time, 50% reduction in prey detection/capture.
Function Type
continuous
Stressor Scale
linear
References Cited
Naman, S. M. (2026). Developing temperature-dependent habitat suitability curves for instream flow modeling. North American Journal of Fisheries Management. Advance online publication. https://doi.org/10.1093/najfmt/vqag077
Images
Stressor Response csv data
Naman 2026 HSI Coho Juvenile Velocity 6C.csv
(360 bytes)
| Raw Stressor Values | Scaled Response Values 0 to 100 | SD | low.limit | up.limit |
|---|---|---|---|---|
| 0.01 | 9 | 0 | 0 | 100 |
| 0.03 | 44 | 0 | 0 | 100 |
| 0.05 | 77 | 0 | 0 | 100 |
| 0.07 | 100 | 0 | 0 | 100 |
| 0.09 | 98 | 0 | 0 | 100 |
| 0.11 | 96 | 0 | 0 | 100 |
| 0.13 | 93 | 0 | 0 | 100 |
| 0.15 | 90 | 0 | 0 | 100 |
| 0.17 | 86 | 0 | 0 | 100 |
| 0.19 | 82 | 0 | 0 | 100 |
| 0.21 | 79 | 0 | 0 | 100 |
| 0.23 | 74 | 0 | 0 | 100 |
| 0.25 | 70 | 0 | 0 | 100 |
| 0.27 | 58 | 0 | 0 | 100 |
| 0.29 | 41 | 0 | 0 | 100 |
| 0.31 | 24 | 0 | 0 | 100 |
| 0.33 | 8 | 0 | 0 | 100 |
| 0.34 | 0 | 0 | 0 | 100 |
Stressor Response Chart
Mean Response
±1 Standard Deviation
Upper/Lower Limits