
Hampton 1988: HSI Coho Fry Depth
mbayly
View all records in the stressor response library
Species Common Name
Coho Salmon
Latin Name (Genus species)
Oncorhynchus kisutch
Stressor Name
Depth
Specific Stressor Metric
Water Depth (total depth)
Stressor Units
m
Vital Rate (Process)
Habitat Suitability Index
Geography
Trinity River California
Detailed SR Function Description
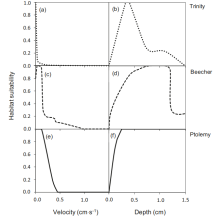
Trinity River coho salmon depth habitat suitability curve (Hampton 1988) as used by Rosenfeld & Ptolemy (2012). Suitability rises from 0 at 0 m to an optimum at ~0.34 - 0.39 m (consistent with Hampton's reported fry preference of 0.9 - 1.2 ft), declines to ~0.23 by ~0.8 m, has a minor secondary hump near 1.0 m, and approaches 0 at ~1.5 m. Values were extracted from the vector line work of the published figure (dotted/solid lines traced point-by-point and simplified), so they approximate the original curves to within ~0.01 m and ~1 suitability unit. Note the figure's axis labels read cm·s⁻¹ and cm, but the scales (0 - 1.5) are clearly m/s and m.
Stressor-response relationship data sourced from: Rosenfeld & Ptolemy (2012) Fig. 2b - Depth habitat suitability curve for coho salmon, Trinity River (dotted line) (p. 1923).
Likely to have low transferability.
Stressor-response relationship data sourced from: Rosenfeld & Ptolemy (2012) Fig. 2b - Depth habitat suitability curve for coho salmon, Trinity River (dotted line) (p. 1923).
Likely to have low transferability.
Function Derivation
Empirical frequency-of-use (use/availability) preference curve from snorkel observations, smoothed and normalized to 0-1.
Transferability of Function
LOW: Developed for a large regulated California river; the extreme preference for zero velocity is likely site-specific.
Source of stressor Data
Hampton (1988): snorkel observations of coho fry (≤50 mm FL; 130 observations, 913 fish) vs. IFG4-modelled habitat availability, 1985–1987.
Function Type
continuous
Stressor Scale
linear
References Cited
Rosenfeld, J. S., & Ptolemy, R. (2012). Modelling available habitat versus available energy flux: Do PHABSIM applications that neglect prey abundance underestimate optimal flows for juvenile salmonids? Canadian Journal of Fisheries and Aquatic Sciences, 69(12), 1920–1934. https://doi.org/10.1139/f2012-115.
Hampton, H. (1988). Development of habitat preference criteria for anadromous salmonids of the Trinity River. U.S. Department of the Interior, Fish and Wildlife Service, Division of Ecological Services, Sacramento, California.
Hampton, H. (1988). Development of habitat preference criteria for anadromous salmonids of the Trinity River. U.S. Department of the Interior, Fish and Wildlife Service, Division of Ecological Services, Sacramento, California.
Citation Link
Images
Stressor Response csv data
Hampton 1988 (Rosenfeld 2012) HSI Coho Fry Depth.csv
(322 bytes)
| Raw Stressor Values | Scaled Response Values 0 to 100 | SD | low.limit | up.limit |
|---|---|---|---|---|
| 0 | 0 | 0 | 0 | 100 |
| 0.281 | 87 | 0 | 0 | 100 |
| 0.32 | 98 | 0 | 0 | 100 |
| 0.34 | 100 | 0 | 0 | 100 |
| 0.385 | 100 | 0 | 0 | 100 |
| 0.409 | 98 | 0 | 0 | 100 |
| 0.658 | 41 | 0 | 0 | 100 |
| 0.712 | 31 | 0 | 0 | 100 |
| 0.737 | 28 | 0 | 0 | 100 |
| 0.81 | 23 | 0 | 0 | 100 |
| 0.856 | 22 | 0 | 0 | 100 |
| 1.041 | 24 | 0 | 0 | 100 |
| 1.129 | 22 | 0 | 0 | 100 |
| 1.247 | 16 | 0 | 0 | 100 |
| 1.468 | 2 | 0 | 0 | 100 |
Stressor Response Chart
Mean Response
±1 Standard Deviation
Upper/Lower Limits