
Rosenfeld et al. 2016: HSI Coho Juvenile Depth (12 cm FL)
mbayly
View all records in the stressor response library
Species Common Name
Coho Salmon
Latin Name (Genus species)
Oncorhynchus kisutch
Stressor Name
Depth
Specific Stressor Metric
Water Depth (total depth; 12-cm FL juvenile)
Stressor Units
m
Vital Rate (Process)
Habitat Suitability Index
Geography
Washington/BC.
Key Covariates and Dependencies
Fork Length 12 cm
Water Temperature Constant at 12C
Detailed SR Function Description
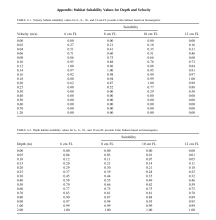
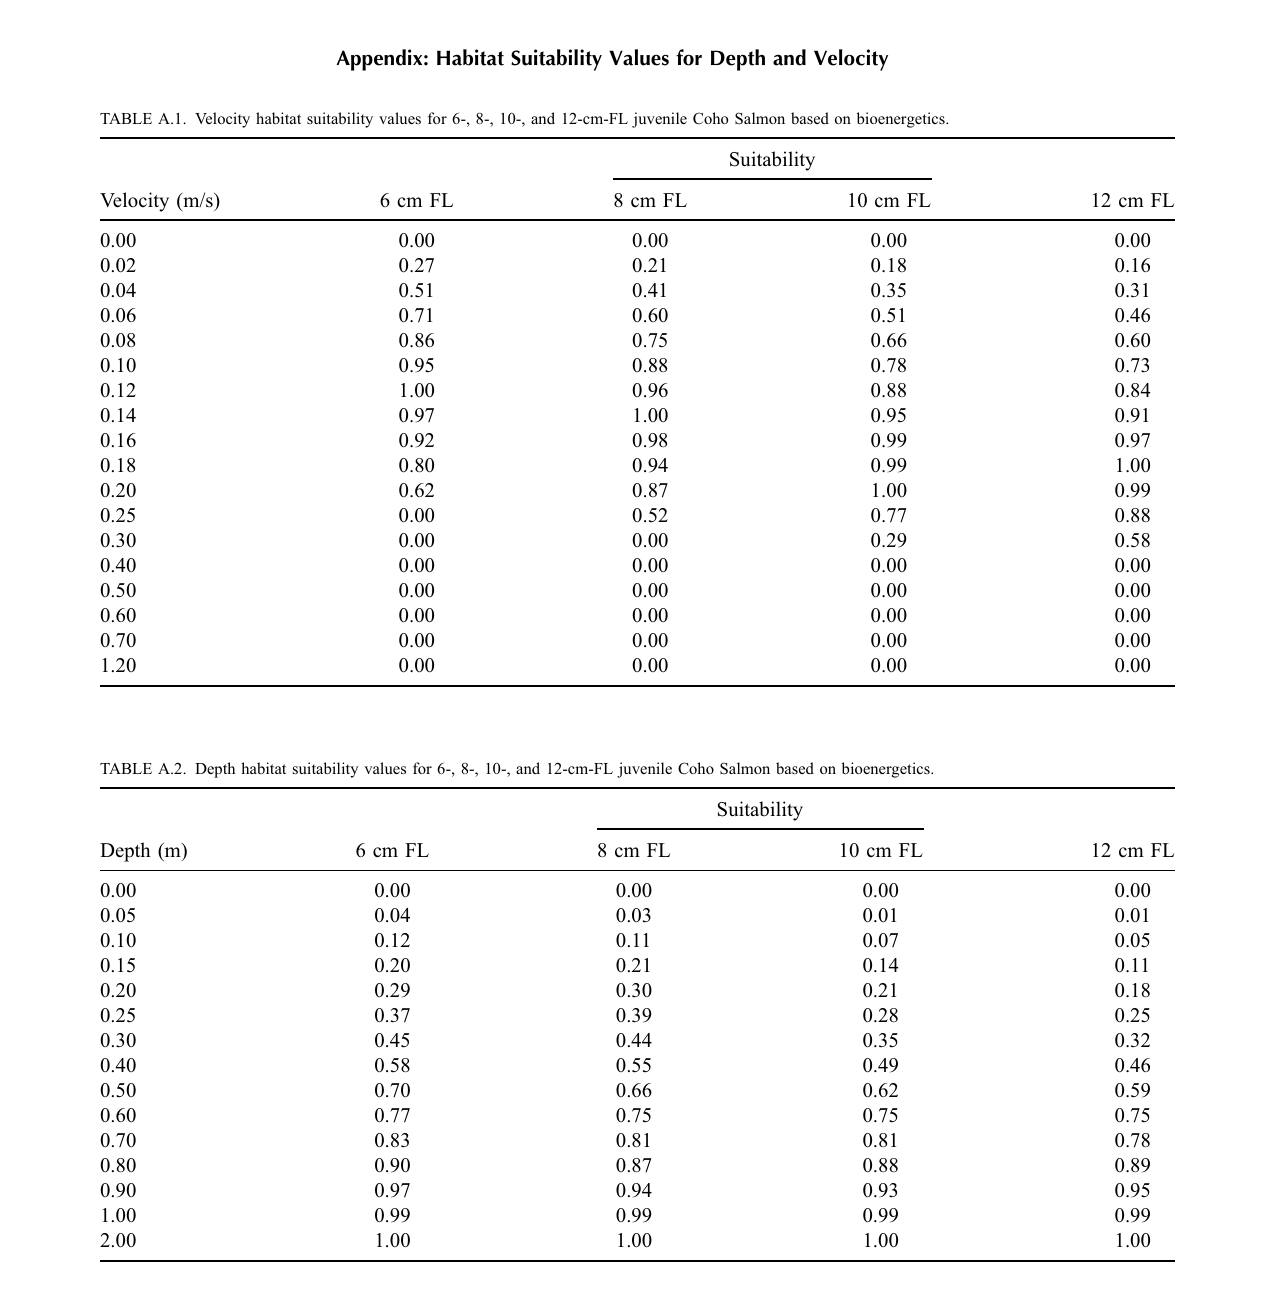
Bioenergetic-based depth habitat suitability curve for 12-cm fork length (~21.2 g) juvenile Coho Salmon. Suitability is standardized net energy intake from a drift-foraging model (focal depth assumed at 40% of water column depth), rescaled to 0–100. Suitability increases with depth as the volume of the reactive field (and therefore prey flux) increases, approaching the maximum at ~1 m; unlike frequency-based depth curves, suitability does not decline in deep water.
Stressor-response relationship data sourced from: Appendix, TABLE A.2. Depth habitat suitability values for 6-, 8-, 10-, and 12-cm-FL juvenile Coho Salmon based on bioenergetics — 12 cm FL column (p. 1219); see also Figure 3b.
See curve for 6cm FL. See source publication for remaining curves.
Stressor-response relationship data sourced from: Appendix, TABLE A.2. Depth habitat suitability values for 6-, 8-, 10-, and 12-cm-FL juvenile Coho Salmon based on bioenergetics — 12 cm FL column (p. 1219); see also Figure 3b.
See curve for 6cm FL. See source publication for remaining curves.
Function Derivation
Mechanistic drift-foraging bioenergetic (net energy intake) model, standardized to a maximum of 1.
Transferability of Function
Sensitive to drift concentration, temperature (fixed at 12°C) and fish size; best suited to drift-feeding juvenile salmonids.
Source of stressor Data
Drift-foraging bioenergetic model (Hughes & Dill 1990 framework) run over homogeneous depth-velocity fields; drift concentrations from Husdon Creek, BC; fixed 12°C.
Function Type
continuous
Stressor Scale
linear
References Cited
Rosenfeld, J., Beecher, H., & Ptolemy, R. (2016). Developing bioenergetic-based habitat suitability curves for instream flow models. North American Journal of Fisheries Management, 36(5), 1205–1219.
Citation Link
Images
Stressor Response csv data
Rosenfeld 2016 HSI Coho Juvenile Depth 12cm FL.csv
(294 bytes)
| Raw Stressor Values | Scaled Response Values 0 to 100 | SD | low.limit | up.limit |
|---|---|---|---|---|
| 0 | 0 | 0 | 0 | 100 |
| 0.05 | 1 | 0 | 0 | 100 |
| 0.1 | 5 | 0 | 0 | 100 |
| 0.15 | 11 | 0 | 0 | 100 |
| 0.2 | 18 | 0 | 0 | 100 |
| 0.25 | 25 | 0 | 0 | 100 |
| 0.3 | 32 | 0 | 0 | 100 |
| 0.4 | 46 | 0 | 0 | 100 |
| 0.5 | 59 | 0 | 0 | 100 |
| 0.6 | 75 | 0 | 0 | 100 |
| 0.7 | 78 | 0 | 0 | 100 |
| 0.8 | 89 | 0 | 0 | 100 |
| 0.9 | 95 | 0 | 0 | 100 |
| 1 | 99 | 0 | 0 | 100 |
| 2 | 100 | 0 | 0 | 100 |
Stressor Response Chart
Mean Response
±1 Standard Deviation
Upper/Lower Limits