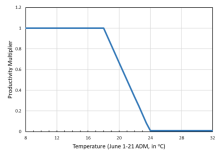
Beechie et al. 2021 Summer Temperature and Juvenile Survival
mbayly
View all records in the stressor response library
Species Common Name
Chinook Salmon
Latin Name (Genus species)
Oncorhynchus tshawytscha
Stressor Name
Stream Temperature
Specific Stressor Metric
June 1-21 average daily maximum
Stressor Units
°C
Vital Rate (Process)
Survival
Geography
Chehalis River, Washington
Detailed SR Function Description
"For spring and fall Chinook, we use the June 1-21 average daily maximum temperature to estimate the temperature effect on productivity of juvenile Chinook parr migrating down the mainstem Chehalis in June (migration data from Winkowski and Zimmerman 2019). We use June 1-21 because that is the time period of peak outmigration (Figure I.5). Very few fish are migrating in the last week of June, so we did not include that week in the temperature calculation. Based on data from Winkowski and Zimmerman (2019) we estimate that 45% of parr are affected (red box in Figure I.5), which is the number of Chinook parr counted in the first 3 weeks in June, divided by total Chinook parr counted for the season. The functional relationship between the June 1-21 average daily maximum temperature and spring and fall Chinook outmigrant productivity multiplier (Figure I.6) is:
This equation is applied to the 45% of juveniles that are migrating from June 1-21.” (Beechie et al. 2021, p. 230)
This equation is applied to the 45% of juveniles that are migrating from June 1-21.” (Beechie et al. 2021, p. 230)
Function Derivation
empirical data
Transferability of Function
This function was derived from temperatures and juvenile outmigration counts at a screw trap on the Chehalis River, Washington. It could be applied to similar systems with Chinook Salmon with caution.
Source of stressor Data
"Spring Chinook upstream migration productivity and coho, steelhead, and late migrant Chinook summer rearing productivity are a function of stream temperature. The input data sets for current stream temperature are from WDFW (Chehalis Thermalscape data for 226 tributaries) and Portland State University (PSU, mainstem from Crim Creek to Porter Creek). Temperature differences for historical and future scenarios are based on the shade and temperature model of Seixas et al. (2018) and climate change projections from NorWeST(https://www.fs.fed.us/rm/boise/AWAE/projects/NorWeST/ModeledStreamTemperatureScenarioMaps.shtml). We model effects of the 7-day average daily maximum summer stream temperature (7-DADM) for coho salmon and steelhead juveniles, and spring Chinook adults, because these fish are in freshwater during the period of high temperatures. Most spring and fall Chinook migrate to the bay prior to high temperatures in summer, and therefore we only model a June temperature effect on the late Chinook juvenile migrants. Because juvenile coho and steelhead have different thermal tolerances, we model the temperature effect with a different functional relationship for each species.” (Beechie et al. 2021 pp. 226-227)
Function Type
continuous
Stressor Scale
linear
References Cited
Beechie, T. J., C. Nicol, C. Fogel, J. Jorgensen, J. Thompson, G. Seixas, J. Chamberlin, J. Hall, B. Timpane-Padgham, P. Kiffney, S. Kubo, and J. Keaton. 2021. Modeling Effects of Habitat Change and Restoration Alternatives on Salmon in the Chehalis River Basin Using a Salmonid Life-Cycle Model. U.S. Department of Commerce, NOAA Contract Report NMFS-NWFSC-CR-2021-01.
Winkowski, J., and M. S. Zimmerman. 2019. Chehalis River Smolt Production, 2018, FPA 19- 01. Washington Department of Fish and Wildlife, Olympia, WA.
Winkowski, J., and M. S. Zimmerman. 2019. Chehalis River Smolt Production, 2018, FPA 19- 01. Washington Department of Fish and Wildlife, Olympia, WA.
File Upload
Summary Report
(96.25 KB)
Excel Workbook
(140.04 KB)
Stressor Response csv data
Data_CHSA_summerTemp_juvSurvival.csv
(448 bytes)
| Temperature (June 1-21 ADM) | Juvenile Survival (%) | SD | low.limit | up.limit |
|---|---|---|---|---|
| 8 | 100 | 0 | 0 | 100 |
| 9 | 100 | 0 | 0 | 100 |
| 10 | 100 | 0 | 0 | 100 |
| 11 | 100 | 0 | 0 | 100 |
| 12 | 100 | 0 | 0 | 100 |
| 13 | 100 | 0 | 0 | 100 |
| 14 | 100 | 0 | 0 | 100 |
| 15 | 100 | 0 | 0 | 100 |
| 16 | 100 | 0 | 0 | 100 |
| 17 | 100 | 0 | 0 | 100 |
| 18 | 100 | 0 | 0 | 100 |
| 19 | 83 | 0 | 0 | 100 |
| 20 | 66 | 0 | 0 | 100 |
| 21 | 49 | 0 | 0 | 100 |
| 22 | 32 | 0 | 0 | 100 |
| 23 | 15 | 0 | 0 | 100 |
| 24 | 0 | 0 | 0 | 100 |
| 25 | 0 | 0 | 0 | 100 |
| 26 | 0 | 0 | 0 | 100 |
| 27 | 0 | 0 | 0 | 100 |
| 28 | 0 | 0 | 0 | 100 |
| 29 | 0 | 0 | 0 | 100 |
| 30 | 0 | 0 | 0 | 100 |
| 31 | 0 | 0 | 0 | 100 |
| 32 | 0 | 0 | 0 | 100 |
Stressor Response Chart
Mean Response
±1 Standard Deviation
Upper/Lower Limits

