Combs and Burrows 1957: Incubation Temp and Chinook Eggs
mbayly
View all records in the stressor response library
Species Common Name
Chinook Salmon
Latin Name (Genus species)
Oncorhynchus tshawytscha
Stressor Name
Temperature
Specific Stressor Metric
Incubation Temperature
Stressor Units
°C
Vital Rate (Process)
Survival
Geography
Laboratory Experiment
Detailed SR Function Description
Data and plot summarized from Bratovich et al., 2020:
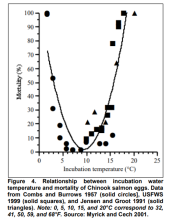
"Myrick and Cech (2001) combined mortality data of Chinook salmon eggs from fertilization to
hatching from laboratory experiments for multiple water temperature treatments, ranging from
35°F to 68.4°F (~2 to 20°C) (Figure 4). The function applied to the mortality data appears to be a
quadratic function, where mortality decreases at an increasing rate as water temperature warms
from about 35°F to 50°F, and higher mortality at an increasing rate as water temperature warms
from about 50°F to 65°F. Because these data represent total mortality of incubating eggs over the
course of the respective incubation periods for each treatment and study, this relationship was not
used to estimate daily mortality rates in this TM. However, it does illustrate the notable increases
in mortality that occur with increases in water temperature above about 15°C (59°F)."
Function roughly equal to Survival = -1.0925x2 + 20.202x + 2.9062; R² = 0.9936 (where x is temp in degrees C)
Function Derivation
Lab experiment
Source of stressor Data
Multiple laboratory experiments
Function Type
continuous
Stressor Scale
linear
References Cited
Bratovich, P., M. Neal, A. Ransom, P. Bedore, and M. Bryan. 2020. Chinook Salmon Early Lifestage
Survival & Folsom Dam Power Bypass Considerations. Prepared for the Sacramento Water Forum.
September 2020.
Combs, B.D. and R.E. Burrows. 1957. Threshold Temperatures for the Normal Development of
Chinook Salmon Eggs. The Progressive Fish-Culturist, 19:3-6.
Myrick, C. A. and J. J. Cech. 2001. Temperature Effects on Chinook Salmon and Steelhead: A
Review Focusing on California’s Central Valley Populations. Bay‐Delta Modeling Forum
Technical Publication 01‐1.
Citation Link
Stressor Response csv data
Combs_0.csv
(685 bytes)
| Raw Stressor Values | Scaled Response Values 0 to 100 | SD | low.limit | up.limit |
|---|---|---|---|---|
| 0.08 | 4.5 | 20 | 0 | 50 |
| 0.39 | 10.6 | 20 | 0 | 50 |
| 0.86 | 19.5 | 20 | 10 | 50 |
| 1.49 | 30.6 | 20 | 20 | 75 |
| 1.65 | 33.3 | 20 | 25 | 75 |
| 2.51 | 46.7 | 20 | 40 | 75 |
| 2.66 | 48.9 | 20 | 45 | 100 |
| 3.53 | 60.6 | 20 | 50 | 100 |
| 4 | 66.2 | 20 | 50 | 100 |
| 4.47 | 71.4 | 20 | 50 | 100 |
| 5.33 | 79.5 | 20 | 55 | 100 |
| 6.11 | 85.6 | 20 | 60 | 100 |
| 7.13 | 91.4 | 20 | 60 | 100 |
| 7.99 | 94.6 | 20 | 60 | 100 |
| 8.86 | 96.1 | 20 | 55 | 100 |
| 9.8 | 96 | 20 | 50 | 100 |
| 10.89 | 93.3 | 20 | 50 | 100 |
| 11.76 | 89.4 | 20 | 40 | 100 |
| 12.77 | 82.7 | 20 | 20 | 100 |
| 14.03 | 71.3 | 20 | 10 | 100 |
| 14.18 | 69.7 | 20 | 0 | 100 |
| 14.89 | 61.5 | 20 | 0 | 100 |
| 15.67 | 51.2 | 20 | 0 | 100 |
| 16.14 | 44.4 | 20 | 0 | 100 |
| 17.01 | 30.4 | 20 | 0 | 85 |
| 17.63 | 19.5 | 20 | 0 | 85 |
| 17.79 | 16.5 | 20 | 0 | 85 |
| 18.1 | 10.6 | 20 | 0 | 85 |
| 18.42 | 4.3 | 20 | 0 | 85 |
| 18.57 | 1.3 | 20 | 0 | 85 |
Stressor Response Chart
Mean Response
±1 Standard Deviation
Upper/Lower Limits

