Flood Recurrence Interval and Egg-to-Fry Survival
mbayly
View all records in the stressor response library
Species Common Name
Chinook Salmon
Latin Name (Genus species)
Oncorhynchus tshawytscha
Stressor Name
Peak Flow
Specific Stressor Metric
Flood Recurrence Interval
Stressor Units
Years
Vital Rate (Process)
Survivorship
Geography
Skagit River, Washington
Detailed SR Function Description
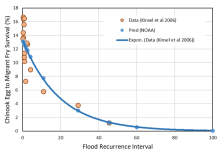
“Effects of peak flows on egg to migrant fry survival have been documented in Chinook salmon in the Skagit River basin (Kinsel et al. 2007), and are presumed to reflect scour of eggs in the gravel due to the overlap in timing of floods and the incubation period. A similar effect is presumed to occur in other river basins. The data from the Skagit River basin are shown in Figure I.9, along with predicted survivals using an exponential regression relationship. Note that the recurrence interval on the x-axis is based on the Skagit River near Mount Vernon, which is low on the mainstem Skagit.
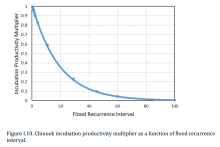
In the Chehalis basin, we rescale this relationship to create a multiplier that ranges from 1 at RI = 0 to near zero at RI = 100 (Figure I.10). The equation for the relationship is:
where MultiplierPi is the incubation productivity multiplier and RI is the flood recurrence interval. In each year of the model run, the multiplier is then calculated using this function, based on the flood recurrence interval for that year. We used peak flow at the USGS gage on the Chehalis River at Porter as the index flow. Peak flows, probabilities of occurrence, and recurrence intervals were calculated using the PeakFQ USGS software (https://water.usgs.gov/software/PeakFQ/). Results for that gage are shown in Table I.3.” (Beechie et al. 2021, p. 230)
Function Derivation
empirical data
Transferability of Function
This function was derived from egg-to-migrant survival estimates from annual monitoring in the Skagit River. It could be applied with caution to other Chinook Salmon systems.
Source of stressor Data
This function is not currently being used in CEMPRA or in the Beechie NOAA model. Stressor magnitude data could be extracted from USGS hydro gauge data.
Function Type
continuous
Stressor Scale
linear
References Cited
Beechie, T. J., C. Nicol, C. Fogel, J. Jorgensen, J. Thompson, G. Seixas, J. Chamberlin, J. Hall, B. Timpane-Padgham, P. Kiffney, S. Kubo, and J. Keaton. 2021. Modeling Effects of Habitat Change and Restoration Alternatives on Salmon in the Chehalis River Basin Using a Salmonid Life-Cycle Model. U.S. Department of Commerce, NOAA Contract Report NMFS-NWFSC-CR-2021-01.
Kinsel, C., G. Volkhardt, L. Kishimoto, and P. Topping. 2007. 2006 Skagit River Wild Salmon Production Evaluation. Washington Department of Fish and Wildlife, FPA 07-05, Olympia, WA.
Kinsel, C., G. Volkhardt, L. Kishimoto, and P. Topping. 2007. 2006 Skagit River Wild Salmon Production Evaluation. Washington Department of Fish and Wildlife, FPA 07-05, Olympia, WA.
File Upload
Stressor Response csv data
Flood Reoccurance.csv
(282 bytes)
| Stressor (X) | Mean System Capacity (%) | SD | low.limit | up.limit |
|---|---|---|---|---|
| 0 | 100 | 0 | 0 | 100 |
| 2 | 91.91 | 0 | 0 | 100 |
| 5 | 78.4 | 0 | 0 | 100 |
| 10 | 60.15 | 0 | 0 | 100 |
| 20 | 35.4 | 0 | 0 | 100 |
| 30 | 20.84 | 0 | 0 | 100 |
| 40 | 12.27 | 0 | 0 | 100 |
| 50 | 7.22 | 0 | 0 | 100 |
| 60 | 4.25 | 0 | 0 | 100 |
| 70 | 2.5 | 0 | 0 | 100 |
| 80 | 1.47 | 0 | 0 | 100 |
| 90 | 0.87 | 0 | 0 | 100 |
| 100 | 0.51 | 0 | 0 | 100 |
Stressor Response Chart
Mean Response
±1 Standard Deviation
Upper/Lower Limits


