Habitat Loss and Westslope Cutthroat Trout
mbakken
View all records in the stressor response library
Species Common Name
Westslope Cutthroat Trout
Latin Name (Genus species)
Oncorhynchus clarkii lewisi
Stressor Name
Habitat loss
Specific Stressor Metric
Direct habitat loss
Stressor Units
% lost
Vital Rate (Process)
System capacity
Geography
Alberta foothills watersheds, excluding National Parks
Detailed SR Function Description
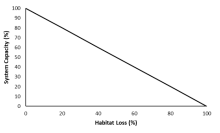
Habitat loss and degradation is often cited as a major impact and limiting factor for fish populations (e.g., native trout recovery plans). This stressor-response curve is exclusively meant to capture direct habitat loss. Direct habitat loss is defined as the removal of portions of a natural stream, or replacement of portions of a natural stream with a different landscape feature. For example, strip-mining for coal in parts of the native trout range has deleted some stream sections, or has resulted in the replacement of streams sections with open-pit lakes or with channeled stream analogs (i.e., a ditch) that do not provide trout habitat. The stressor-response curve for habitat loss is depicted by a linear relationship between the percentage of stream habitat lost and system capacity (Figure 1).
Function Derivation
Expert opinion
Transferability of Function
This function was developed and applied to Bull Trout, Athabasca Rainbow Trout, and Westslope Cutthroat Trout in Alberta foothills watersheds. The generality of this curve indicates that it could be safely applied to any species or system where proportion of direct habitat loss could be calculated.
Source of stressor Data
GIS-derived estimates of stream habitat lost or converted to different landscape features in the spatial unit of interest.
Function Type
continuous
Stressor Scale
linear
References Cited
Government of Alberta. 2024. Direct habitat loss stressor-response function for Athabasca Rainbow Trout, Westslope Cutthroat Trout, and Bull Trout. Environment and Protected Area Native Trout Cumulative Effects Model.
File Upload
Images

Stressor Response csv data
Data_WSCT_habitatLoss.csv
(153 bytes)
| Habitat Loss (%) | Mean System Capacity (%) | SD | low.limit | up.limit |
|---|---|---|---|---|
| 0 | 100 | 0 | 0 | 100 |
| 20 | 80 | 0 | 0 | 100 |
| 40 | 60 | 0 | 0 | 100 |
| 60 | 40 | 0 | 0 | 100 |
| 80 | 20 | 0 | 0 | 100 |
| 100 | 0 | 0 | 0 | 100 |
Stressor Response Chart
Mean Response
±1 Standard Deviation
Upper/Lower Limits