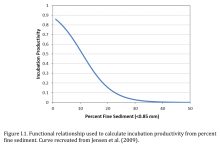
Jensen et al 2009: Fine Sediment and Incubation Survival
mbayly
View all records in the stressor response library
Species Common Name
Pacific salmon (generalized)
Stressor Name
Sedimentation
Specific Stressor Metric
Fine Sediment
Stressor Units
% fines (0.85mm)
Vital Rate (Process)
Survivorship
Life Stage
Activity
Incubation
Geography
Pacific Northwest
Key Covariates and Dependencies
Slope
Bankfull Width
Detailed SR Function Description
Reach-averaged percentage of fine sediment (<0.85mm) in spawning gravels and modelled density-independent incubation productivity (survival).
Fine sediment data came from a combination of field surveys and estimates from empirical models. Empirical model estimated reach-averaged fine sediment as a function of road density (fine sed = 5.74 + 2.05 * road density, where road density is the surface area coverage of the drainage area, ha roads/ha watershed). This function is unlikely to be transferable to other systems..
Sediment to incubation productivity is derived from source data in Jensen et al. 2009. Synthetic function for sediment is intended to be generalized for all pacific salmon.
Underlying formula is Incubation Productivity = 1 / (1 + e^-(B0 + B1*sed)), where B0 is 1.989 and B1 is -0.185.
See Appendix I.3: Fine Sediment for additional details.
Scaled from original curve so that when fine sediment is zero incubation survivorship is 100% (instead of 88%)
Keywords: Sediment, fines, sedimentation, productivity, survival
Stressor Magnitude Data
Empirical model that estimates fine sediment from road density, slope and bankfull width
PoE Chain
Upland development, road building, fine sediment, smothering of eggs, egg to fry surviorship
Function Type
continuous
Stressor Scale
linear
References Cited
Beechie, T. J., C. Nicol, C. Fogel, J. Jorgensen, J. Thompson, G. Seixas, J. Chamberlin, J. Hall, B. Timpane-Padgham, P. Kiffney, S. Kubo, and J. Keaton. 2021. Modeling Effects of Habitat Change and Restoration Alternatives on Salmon in the Chehalis River Basin Using a Salmonid Life-Cycle Model. U.S. Department of Commerce, NOAA Contract Report NMFS-NWFSC-CR-2021-01.
Jensen, D. W., E. A. Steel, A. H. Fullerton, and G. R. Pess. 2009. Impact of fine sediment on incubation survival of Pacific salmon: a meta-analysis of published studies. Reviews in Fisheries Science 17(3):348-359.
Jensen, D. W., E. A. Steel, A. H. Fullerton, and G. R. Pess. 2009. Impact of fine sediment on incubation survival of Pacific salmon: a meta-analysis of published studies. Reviews in Fisheries Science 17(3):348-359.
Citation Link
Stressor Response csv data
fine_sediment (1).csv
(371 bytes)
| Stressor (X) | Mean System Capacity (%) | SD | low.limit | up.limit |
|---|---|---|---|---|
| 0.1 | 100 | 20 | 45 | 100 |
| 2.33 | 94.6 | 25 | 45 | 100 |
| 4.07 | 88.85 | 25 | 30 | 100 |
| 6.1 | 80.93 | 30 | 30 | 100 |
| 7.85 | 72.66 | 30 | 30 | 100 |
| 9.98 | 61.15 | 25 | 15 | 100 |
| 12.79 | 47.12 | 25 | 15 | 100 |
| 15.99 | 32.01 | 20 | 2.5 | 85 |
| 18.99 | 21.58 | 20 | 0 | 85 |
| 22.09 | 12.95 | 10 | 0 | 35 |
| 24.03 | 10.43 | 7.5 | 0 | 35 |
| 28 | 5.4 | 5 | 0 | 10 |
| 33.04 | 2.88 | 2.5 | 0 | 10 |
| 38.76 | 1.8 | 1 | 0 | 10 |
| 49.32 | 1.08 | 0 | 0 | 10 |
Stressor Response Chart
Mean Response
±1 Standard Deviation
Upper/Lower Limits

