Mean Annual Discharge and Chinook Salmon
mbakken
View all records in the stressor response library

Species Common Name
Chinook Salmon
Latin Name (Genus species)
Oncorhynchus tshawytscha
Stressor Name
Flow
Specific Stressor Metric
Mean Annual Discharge (MAD)
Stressor Units
%
Vital Rate (Process)
Egg-smolt survival
Life Stage
Season
Fall-Early Summer
Geography
Marsh Creek, Washington, USA
Detailed SR Function Description
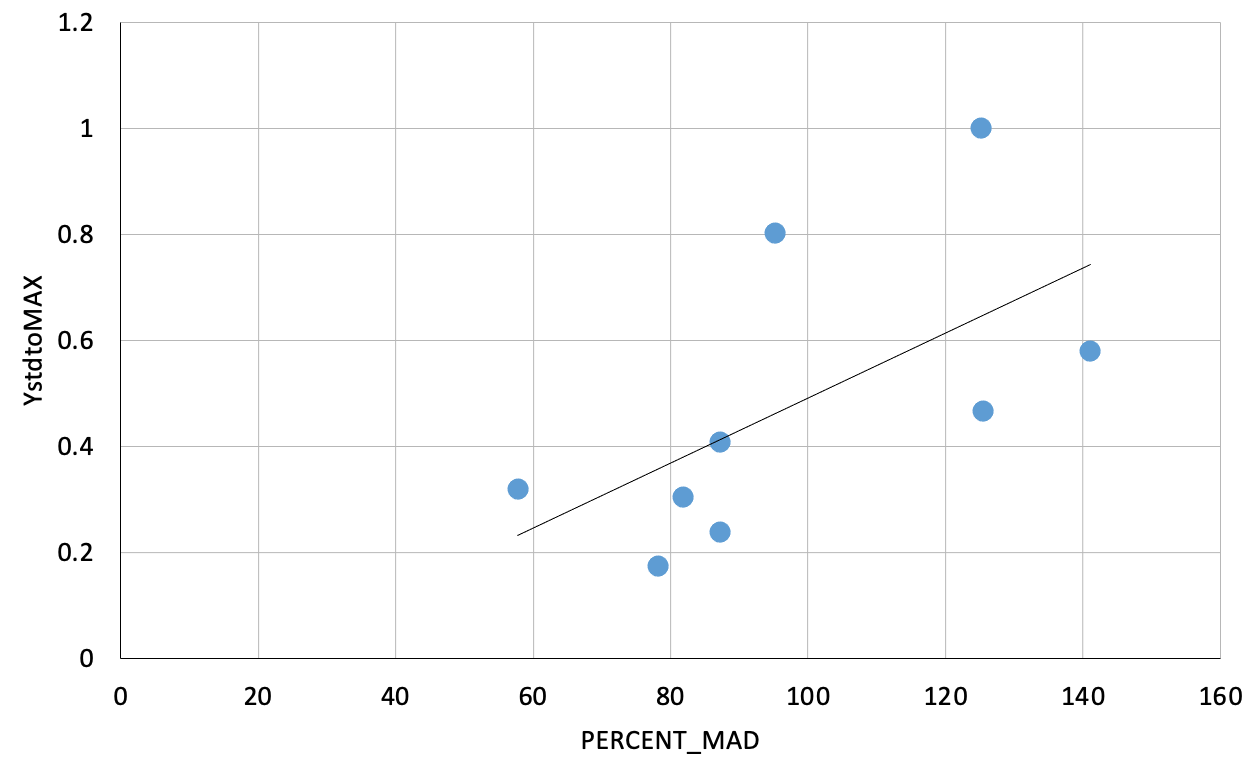
Arthaud et al. (2010) used a time series of adult returns from the Lemhi River and Marsh Creek populations of Chinook salmon to estimate the effects of tributary stream flow in the brood year on returning adults four to five years later.
The SR function was derived only the relationship for August flows as minimize pseudo replication from including 2 months (both May and August) with similar underlying flow-ecology mechanisms. Similarly, only one of egg-trap transition rate and egg-smolt survival responses was used because they were highly correlated responses.
Implicit pathway of flow effect: passage/migration
Function Derivation
Observational data and expert elucidation
Transferability of Function
Appropriate for late-summer stream flow impacts on chinook salmon juveniles and egg-to-smolt. General transferability to other chinooks stocks in unclear, but likely appropriate for other fall-spawning stocks (i.e., regions with similar hydrology to the Marsh Creek).
The relationship may be unreliable if extrapolated to a flow range outside the original data (see the Average Salmonid flow-ecology SR function entry based on Rosenfeld and Enright (2025) for a more generalizable function across a wider range of flows).
The relationship may be unreliable if extrapolated to a flow range outside the original data (see the Average Salmonid flow-ecology SR function entry based on Rosenfeld and Enright (2025) for a more generalizable function across a wider range of flows).
Source of stressor Data
The authors used a downstream gage on the Middle Fork Salmon River at Shoup as a proxy for Marsh Creek flow. This proxy was considered reliable because the temporary gage records from Marsh Creek showed a "correspondence" and "synchronous flows" (r(8 df) = 0.938, P < 0.01) with the Middle Fork gage records.
Function Type
continuous
Stressor Scale
linear
References Cited
"Arthaud, D.L., Greene, C.M., Guilbault, K., and Morrow, J.V. Jr. 2010.
Contrasting life-cycle impacts of stream flow on two Chinook salmon populations. Hydrobiologia 655: 171-188."
Contrasting life-cycle impacts of stream flow on two Chinook salmon populations. Hydrobiologia 655: 171-188."
File Upload
Images
Stressor Response csv data
Data_Chinook_Flow_Marsh_0.csv
(338 bytes)
| PERCENT_MAD | Mean System Capacity (%) | SD | low.limit | up.limit |
|---|---|---|---|---|
| 57.73684211 | 23.0694737 | 0 | 0 | 100 |
| 78.12105263 | 35.5038421 | 0 | 0 | 100 |
| 81.9 | 37.809 | 0 | 0 | 100 |
| 87.18421053 | 41.0323684 | 0 | 0 | 100 |
| 87.18947368 | 41.0355789 | 0 | 0 | 100 |
| 95.25789474 | 45.9573158 | 0 | 0 | 100 |
| 125.2210526 | 64.2348421 | 0 | 0 | 100 |
| 125.4526316 | 64.3761053 | 0 | 0 | 100 |
| 141.0631579 | 73.8985263 | 0 | 0 | 100 |
Stressor Response Chart
Mean Response
±1 Standard Deviation
Upper/Lower Limits