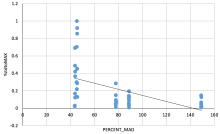
Mean Annual Discharge and Rainbow Trout
mbakken
View all records in the stressor response library
Species Common Name
Rainbow Trout
Latin Name (Genus species)
Oncorhynchus mykiss
Stressor Name
Flow
Specific Stressor Metric
Mean Annual Discharge (MAD)
Stressor Units
%
Vital Rate (Process)
Density
Life Stage
Season
Summer
Geography
Cheakamus River, BC, Canada
Function Type
continuous
Stressor Scale
linear
References Cited
Data extracted from Cheakamus River Water Use Plan Report; MAD obtained through Water Survey of Canada
File Upload
Rainbow Trout - MAD CEMPRA SR Function
(856.6 KB)
Rainbow Trout - MAD CEMPRA SR Function
(135.59 KB)
Stressor Response csv data
Data_Rainbow_Flow_Cheakamus_0.csv
(1.36 KB)
| PERCENT_MAD | Mean System Capacity (%) | SD | low.limit | up.limit |
|---|---|---|---|---|
| 43.32923077 | 34.3347692 | 0 | 0 | 100 |
| 43.49538462 | 34.2766154 | 0 | 0 | 100 |
| 43.50461538 | 34.2733846 | 0 | 0 | 100 |
| 43.51076923 | 34.2712308 | 0 | 0 | 100 |
| 43.51384615 | 34.2701538 | 0 | 0 | 100 |
| 43.66769231 | 34.2163077 | 0 | 0 | 100 |
| 43.67384615 | 34.2141538 | 0 | 0 | 100 |
| 43.67538462 | 34.2136154 | 0 | 0 | 100 |
| 44.48923077 | 33.9287692 | 0 | 0 | 100 |
| 44.82153846 | 33.8124615 | 0 | 0 | 100 |
| 44.99076923 | 33.7532308 | 0 | 0 | 100 |
| 45.14769231 | 33.6983077 | 0 | 0 | 100 |
| 45.15692308 | 33.6950769 | 0 | 0 | 100 |
| 45.31384615 | 33.6401538 | 0 | 0 | 100 |
| 45.31692308 | 33.6390769 | 0 | 0 | 100 |
| 45.32 | 33.638 | 0 | 0 | 100 |
| 45.32 | 33.638 | 0 | 0 | 100 |
| 45.47384615 | 33.5841538 | 0 | 0 | 100 |
| 77.47846154 | 22.3825385 | 0 | 0 | 100 |
| 77.63384615 | 22.3281538 | 0 | 0 | 100 |
| 77.64 | 22.326 | 0 | 0 | 100 |
| 77.64461538 | 22.3243846 | 0 | 0 | 100 |
| 77.64769231 | 22.3233077 | 0 | 0 | 100 |
| 77.65230769 | 22.3216923 | 0 | 0 | 100 |
| 77.97076923 | 22.2102308 | 0 | 0 | 100 |
| 77.97230769 | 22.2096923 | 0 | 0 | 100 |
| 88.47384615 | 18.5341538 | 0 | 0 | 100 |
| 88.47692308 | 18.5330769 | 0 | 0 | 100 |
| 88.48 | 18.532 | 0 | 0 | 100 |
| 88.48153846 | 18.5314615 | 0 | 0 | 100 |
| 88.63076923 | 18.4792308 | 0 | 0 | 100 |
| 88.63846154 | 18.4765385 | 0 | 0 | 100 |
| 88.64307692 | 18.4749231 | 0 | 0 | 100 |
| 88.64769231 | 18.4733077 | 0 | 0 | 100 |
| 88.80923077 | 18.4167692 | 0 | 0 | 100 |
| 148.8738462 | -2.6058462 | 0 | 0 | 100 |
| 148.8784615 | -2.6074615 | 0 | 0 | 100 |
| 148.8830769 | -2.6090769 | 0 | 0 | 100 |
| 148.8846154 | -2.6096154 | 0 | 0 | 100 |
| 148.8892308 | -2.6112308 | 0 | 0 | 100 |
| 149.0461538 | -2.6661538 | 0 | 0 | 100 |
| 149.0523077 | -2.6683077 | 0 | 0 | 100 |
| 149.2030769 | -2.7210769 | 0 | 0 | 100 |
Stressor Response Chart

