Mean Annual Discharge and System Capacity for Chinook Salmon
jrosenfeld
View all records in the stressor response library

Species Common Name
Chinook Salmon
Latin Name (Genus species)
Oncorhynchus tshawytscha
Stressor Name
Flow; Discharge
Specific Stressor Metric
Mean annual discharge
Stressor Units
%
Vital Rate (Process)
Total number of spawners
Geography
Nicola River, BC, Canada
Detailed SR Function Description
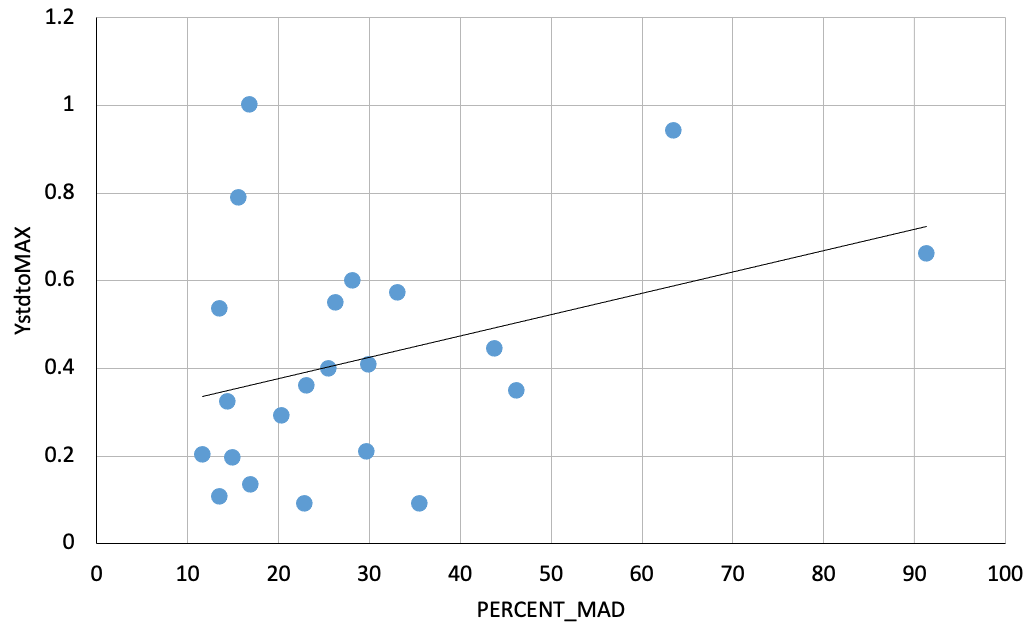
Warkentin et al. (2022) used a time series of adult recruitment from the Nicola River to estimate the effects of August low flows in the brood year (x-axis) on returning adult recruits 4 years later (y-axis). The SR function was derived by regressing the annual residuals from the stock-recruit function on August low flows, reasoning that higher than average adult returns are correlated with higher than average flows in the brood year, and lower than average predicted flows (negative residuals) are correlated with lower flows (See figure 4e in Warkentin et al. 2022 for support of this mechanism). Average adult population size was added to the residuals to generate the final y-values (adult population response) for the final SR function, which was then standardized to a maximum of 1 (or 100% capacity; see Rosenfeld and Enright 2025).
Function Derivation
Observational data (multi-year over time); N = 22
Transferability of Function
Appropriate for late summer low flow spawning impacts on chinook salmon adults; general transferability to other chinooks stocks in unclear, but likely appropriate for other fall-spawning stocks in the B.C. interior (i.e., regions with similar hydrology to the Nicola R.).
The relationship may be unreliable if extrapolated to a flow range outside the original data (see the Average Salmonid flow-ecology SR function entry based on Rosenfeld and Enright (2025) for a more generalizable function across a wider range of flows).
The relationship may be unreliable if extrapolated to a flow range outside the original data (see the Average Salmonid flow-ecology SR function entry based on Rosenfeld and Enright (2025) for a more generalizable function across a wider range of flows).
Source of stressor Data
MAD + estimated water usage based off HYDAT hydrometric data and an estimate of annual water usage (unpublished data, Ptolemy; Summit Environmental Consultants Ltd., 2007). See supplement in Warkentin et al. 2022 for further information.
Stressor was then standardized to % MAD.
Stressor was then standardized to % MAD.
Function Type
continuous
Stressor Scale
linear
References Cited
Warkentin, L., Parken, C. K., Bailey, R., & Moore, J. W. (2022). Low summer river flows associated with low productivity of Chinook salmon in a watershed with shifting hydrology. Ecological Solutions and Evidence, 3(1), e12124.
File Upload
Warkentin_et_al_2022_ESE_0.pdf
(998.39 KB)
Images
Stressor Response csv data
Data_Chinook_Flow_Nicola_Spawning_0.csv
(752 bytes)
| PERCENT_MAD | Mean System Capacity (%) | SD | low.limit | up.limit |
|---|---|---|---|---|
| 11.65536913 | 33.7311309 | 0 | 0 | 100 |
| 13.49328859 | 34.6317114 | 0 | 0 | 100 |
| 13.51208054 | 34.6409195 | 0 | 0 | 100 |
| 14.38926174 | 35.0707383 | 0 | 0 | 100 |
| 14.99161074 | 35.3658893 | 0 | 0 | 100 |
| 15.65167785 | 35.6893221 | 0 | 0 | 100 |
| 16.8 | 36.252 | 0 | 0 | 100 |
| 16.94630872 | 36.3236913 | 0 | 0 | 100 |
| 20.36946309 | 38.0010369 | 0 | 0 | 100 |
| 22.90268456 | 39.2423154 | 0 | 0 | 100 |
| 23.0385906 | 39.3089094 | 0 | 0 | 100 |
| 25.52885906 | 40.5291409 | 0 | 0 | 100 |
| 26.39899329 | 40.9555067 | 0 | 0 | 100 |
| 28.23993289 | 41.8575671 | 0 | 0 | 100 |
| 29.75268456 | 42.5988154 | 0 | 0 | 100 |
| 29.88288591 | 42.6626141 | 0 | 0 | 100 |
| 33.14295302 | 44.260047 | 0 | 0 | 100 |
| 35.56946309 | 45.4490369 | 0 | 0 | 100 |
| 43.72281879 | 49.4441812 | 0 | 0 | 100 |
| 46.19798658 | 50.6570134 | 0 | 0 | 100 |
| 63.53187919 | 59.1506208 | 0 | 0 | 100 |
| 91.34194631 | 72.7775537 | 0 | 0 | 100 |
Stressor Response Chart
Mean Response
±1 Standard Deviation
Upper/Lower Limits