Oxygen Concentration and Food Conversion Ratio in Coho Salmon
stobias
View all records in the stressor response library
Species Common Name
Coho Salmon
Latin Name (Genus species)
Oncorhynchus kisutch
Stressor Name
Dissolved Oxygen
Specific Stressor Metric
Dissolved Oxygen Concentration
Stressor Units
mg/L
Vital Rate (Process)
Growth
Life Stage
Detailed SR Function Description
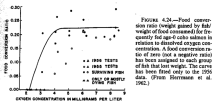
Food conversion ratio (weight gained by fish/weight of food consumed) for frequently fed age-0 coho salmon in relation to dissolved oxygen concentration. A food conversion ratio of zero (not a negative ratio) has been assigned to each group of fish that lost weight. fitted
Function Type
continuous
Stressor Scale
linear
References Cited
Bjornn, T. C., & Reiser, D. W. (1991). Habitat requirements of salmonids in streams. American Fisheries Society Special Publication, 19(837), 119.
Herrmann, R. B., Warren, C. E., & Doudoroff, P. (1962). Influence of oxygen concentration on the growth of juvenile coho salmon. Transactions of the American Fisheries Society, 91(2), 155-167.
Herrmann, R. B., Warren, C. E., & Doudoroff, P. (1962). Influence of oxygen concentration on the growth of juvenile coho salmon. Transactions of the American Fisheries Society, 91(2), 155-167.
File Upload
Prep Workbook_1.xlsx
(13.02 KB)
Stressor Response csv data
4.24 Oxygen Concentration & Food Conversion.csv
(576 bytes)
| Stressor (X) | Mean System Capacity (%) | SD | low.limit | up.limit |
|---|---|---|---|---|
| 2.19 | 0 | 0 | 0 | 100 |
| 2.28 | 9.09 | 9.09 | 0 | 100 |
| 2.39 | 18.18 | 18.18 | 0 | 100 |
| 2.46 | 22.73 | 9.09 | 0 | 100 |
| 2.65 | 31.82 | 22.73 | 0 | 100 |
| 2.79 | 45.45 | 22.73 | 0 | 100 |
| 2.89 | 50 | 27.27 | 0 | 100 |
| 2.89 | 50 | 27.27 | 0 | 100 |
| 3.07 | 59.09 | 36.36 | 0 | 100 |
| 3.23 | 68.18 | 31.82 | 0 | 100 |
| 3.46 | 77.27 | 40.91 | 0 | 100 |
| 3.71 | 90.91 | 27.27 | 0 | 100 |
| 3.81 | 90.91 | 27.27 | 0 | 100 |
| 3.95 | 95.45 | 31.82 | 0 | 100 |
| 4.24 | 100 | 36.36 | 0 | 100 |
| 4.47 | 100 | 22.73 | 0 | 100 |
| 5.02 | 100 | 22.73 | 0 | 100 |
| 5.48 | 100 | 13.64 | 0 | 100 |
| 6.06 | 100 | 13.64 | 0 | 100 |
| 6.62 | 100 | 13.64 | 0 | 100 |
| 7.66 | 100 | 18.18 | 0 | 100 |
| 8.36 | 100 | 13.64 | 0 | 100 |
| 8.55 | 100 | 13.64 | 0 | 100 |
Stressor Response Chart

