
Ptolemy (n.d.): HSI Coho Juvenile Depth
mbayly
View all records in the stressor response library
Species Common Name
Coho Salmon
Latin Name (Genus species)
Oncorhynchus kisutch
Stressor Name
Depth
Specific Stressor Metric
Water Depth (total depth)
Stressor Units
m
Vital Rate (Process)
Habitat Suitability Index
Geography
British Columbia (composit)
Key Covariates and Dependencies
unknown
Detailed SR Function Description
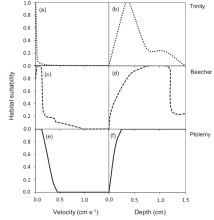
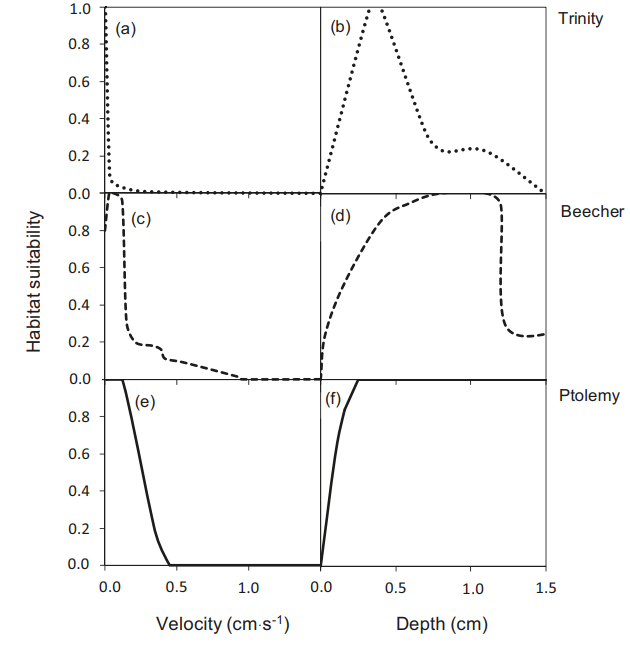
British Columbia juvenile coho depth habitat suitability curve (R. Ptolemy, unpublished) used by Rosenfeld & Ptolemy (2012). Suitability rises steeply from 0 at 0 m to ~0.67 at 0.11 m and ~0.84 at 0.16 m, reaches 1.0 at ~0.25 m, and stays at 1.0 in deeper water (no deep-water decline). Values were extracted from the vector line work of the published figure (solid polyline vertices), so they approximate the original curves to within ~0.01 m and ~1 suitability unit. Note the figure's axis labels read cm·s⁻¹ and cm, but the scales (0–1.5) are clearly m/s and m.
Stressor-response relationship data sourced from: Rosenfeld & Ptolemy (2012) Fig. 2f - Depth habitat suitability curve for coho salmon, Ptolemy (solid line) (p. 1923).
This curve seems to be used very frequently across instream flow studies, despite being unpublished. Users are encouraged to source their own data. There is no data associated with this relationship (context, fish age/stage/size, etc.).
Stressor-response relationship data sourced from: Rosenfeld & Ptolemy (2012) Fig. 2f - Depth habitat suitability curve for coho salmon, Ptolemy (solid line) (p. 1923).
This curve seems to be used very frequently across instream flow studies, despite being unpublished. Users are encouraged to source their own data. There is no data associated with this relationship (context, fish age/stage/size, etc.).
Function Derivation
Empirical: fish density assessments coupled with stream transects (R. Ptolemy, unpublished data).
Transferability of Function
Developed from BC streams across a range of sizes; underlying data unpublished.
Source of stressor Data
R. Ptolemy (BC Ministry of Environment), unpublished juvenile coho density and transect data from streams throughout British Columbia.
Stressor Magnitude Data
unknown
Function Type
continuous
Stressor Scale
linear
References Cited
Rosenfeld, J. S., & Ptolemy, R. (2012). Modelling available habitat versus available energy flux: Do PHABSIM applications that neglect prey abundance underestimate optimal flows for juvenile salmonids? Canadian Journal of Fisheries and Aquatic Sciences, 69(12), 1920–1934.
Citation Link
Images
Stressor Response csv data
Ptolemy (Rosenfeld 2012) HSI Coho Juvenile Depth.csv
(153 bytes)
| Raw Stressor Values | Scaled Response Values 0 to 100 | SD | low.limit | up.limit |
|---|---|---|---|---|
| 0 | 0 | 0 | 0 | 100 |
| 0.113 | 67 | 0 | 0 | 100 |
| 0.16 | 84 | 0 | 0 | 100 |
| 0.252 | 100 | 0 | 0 | 100 |
| 1.5 | 100 | 0 | 0 | 100 |
Stressor Response Chart
Mean Response
±1 Standard Deviation
Upper/Lower Limits