Sullivan 2000: Coho Growth and Stream Temperature
mbayly
View all records in the stressor response library
Species Common Name
Coho Salon
Latin Name (Genus species)
Oncorhynchus kisutch
Stressor Name
Stream Temperature
Specific Stressor Metric
7-DAM (MWMT)
Stressor Units
°C
Vital Rate (Process)
Growth and Survivorship
Geography
Species-wide
Detailed SR Function Description
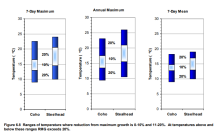
Based on the Sullivan et al. (2000) report, the authors conclude that upper temperature thresholds should be based on a risk assessment of growth loss rather than just lethal limits. Sullivan et al. (2000) determined that to minimize growth loss to no more than 10% of the maximum potential, specific temperature caps are required. They concluded that 16.5°C is the appropriate upper threshold for the 7-day maximum temperature (often referred to as the Maximum Weekly Maximum Temperature or MWMT) for Coho Salmon. If using the 7-day mean temperature (MWAT) instead of the maximum, the report suggests a threshold of 14.8°C to maintain growth within 10% of the optimum.
The authors also analyzed acute lethality (direct mortality) based on the annual instantaneous maximum temperature. They suggest a threshold of 26°C (annual maximum) to prevent direct mortality. The analysis found that while temperatures between 24°C and 26°C can be lethal if exposure is prolonged, natural fluctuation patterns in the Pacific Northwest generally prevent the duration of exposure required to kill fish at these temperatures. Therefore, direct mortality is considered unlikely if the annual maximum remains below 24°C.
7-day average of the daily maximum temperatures (7-DAM), often referred to as the maximum weekly max temp (MWMT); or the 7-day rolling average of daily maximum temperatures. 7-day mean or MWAT generally refers to the average daily mean temperatures.
The authors concluded that various temperature indices (Annual Maximum, 7-day Maximum, and 7-day Mean) are closely correlated with one another. Therefore, any of these metrics can be used effectively to set criteria, provided the specific threshold value is adjusted to match the metric used
Function Derivation
Lab studies
Transferability of Function
Generalizable species-wide coarse estimates.
Function Type
continuous
Stressor Scale
linear
References Cited
Sullivan, K., D. J. Martin, R. D. Carwell, J. E. Toll, and S. Duke. (2000). An analysis of the effects of
temperature on salmonids of the Pacific Northwest with implications for selecting temperature
criteria. Sustainable Ecosystems Institute, Portland, OR (2000).
temperature on salmonids of the Pacific Northwest with implications for selecting temperature
criteria. Sustainable Ecosystems Institute, Portland, OR (2000).
Citation Link
Images

Stressor Response csv data
sullivancoho.csv
(181 bytes)
| 7-DAM | Scaled Response Values 0 to 100 | SD | low.limit | up.limit |
|---|---|---|---|---|
| 13 | 100 | 0 | 0 | 100 |
| 14 | 100 | 0 | 0 | 100 |
| 15 | 100 | 0 | 0 | 100 |
| 16 | 100 | 0 | 0 | 100 |
| 16.5 | 90 | 0 | 0 | 100 |
| 22 | 80 | 0 | 0 | 100 |
| 24 | 0 | 0 | 0 | 0 |
| 26 | 0 | 0 | 0 | 0 |
Stressor Response Chart
Mean Response
±1 Standard Deviation
Upper/Lower Limits