McHugh, Budy & Schaller (2004): Temperature and Chinook Fry Survivorship
stobias
View all records in the stressor response library
Species Common Name
Chinook Salmon (stream type chinook)
Latin Name (Genus species)
Oncorhynchus tshawytscha
Stressor Name
Temperature
Specific Stressor Metric
mean daily temperature
Stressor Units
C
Vital Rate (Process)
Survivorship
Life Stage
Detailed SR Function Description
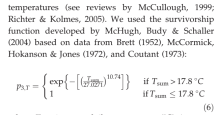
Fry stage: Survivorship through the fry stage to the overwintering stage is influenced by summer water temperatures (see reviews by McCullough, 1999; Richter & Kolmes, 2005). This survivorship function is developed for stream-type chinook by McHugh, Budy & Schaller (2004) based on data from Brett (1952), McCormick, Hokanson & Jones (1972), and Coutant (1973):
Surv = exp{-((Tsum)/(27.0271))^10.74} if Tsum > 17.8
Surv = 1 if Tsum ≤ 17.8
Where Tsum is mean daily temperature (oC) August–September.
Surv = exp{-((Tsum)/(27.0271))^10.74} if Tsum > 17.8
Surv = 1 if Tsum ≤ 17.8
Where Tsum is mean daily temperature (oC) August–September.
Function Type
continuous
Stressor Scale
linear
References Cited
McHugh, P., Budy, P., & Schaller, H. (2004). A model-based assessment of the potential response of Snake River spring–summer Chinook salmon to habitat improvements. Transactions of the American Fisheries Society, 133(3), 622-638.
Honea, J. M., Jorgensen, J. C., McCLURE, M. M., Cooney, T. D., Engie, K., Holzer, D. M., & Hilborn, R. (2009). Evaluating habitat effects on population status: influence of habitat restoration on spring‐run Chinook salmon. Freshwater Biology, 54(7), 1576-1592.
Honea, J. M., Jorgensen, J. C., McCLURE, M. M., Cooney, T. D., Engie, K., Holzer, D. M., & Hilborn, R. (2009). Evaluating habitat effects on population status: influence of habitat restoration on spring‐run Chinook salmon. Freshwater Biology, 54(7), 1576-1592.
Citation Link
File Upload
Excel file showing application of formula
(89.78 KB)
Stressor Response csv data
Honea fig 5.csv
(277 bytes)
| Stressor (X) | Mean System Capacity (%) | SD | low.limit | up.limit |
|---|---|---|---|---|
| 16.8 | 100 | 0 | 0 | 100 |
| 17.8 | 100 | 0 | 0 | 100 |
| 18.8 | 97.99306031 | 0 | 0 | 100 |
| 19.8 | 96.52463997 | 0 | 0 | 100 |
| 20.8 | 94.17225078 | 0 | 0 | 100 |
| 21.8 | 90.53576285 | 0 | 0 | 100 |
| 22.8 | 85.13336276 | 0 | 0 | 100 |
| 23.8 | 77.47479759 | 0 | 0 | 100 |
| 24.8 | 67.22759619 | 0 | 0 | 100 |
Stressor Response Chart
Mean Response
±1 Standard Deviation
Upper/Lower Limits

