Whirling Disease and Athabasca Rainbow Trout
mbakken
View all records in the stressor response library

Species Common Name
Athabasca Rainbow Trout
Latin Name (Genus species)
Oncorhynchus mykiss
Stressor Name
Whirling Disease
Specific Stressor Metric
Whirling Disease Risk Factor
Stressor Units
Unitless
Vital Rate (Process)
System capacity
Geography
Alberta foothills watersheds, excluding National Parks
Detailed SR Function Description
Whirling disease has been detected in some Alberta watersheds, but not in Athabasca rainbow trout ranges, in spite of extensive testing (i.e.,87 sites tested in Athabasca rainbow Trout watersheds during 2016, 2017 and 2019, all tests negative for whirling disease, as of January 2020, M. Veillard, pers. comm. 22 January 2020). The parasite (Myxobolus cerebralis) can cause high levels of juvenile mortality, and rainbow trout in other jurisdictions have been particularly susceptible (Vincent 1996; Nehring and Walker 1996). No specific studies on the vulnerability of Athabasca Rainbow Trout to whirling disease have been conducted, and it is possible that native stocks of fish are more resistant than hatchery-origin stocks (Baerwald et al. 2011). However, if whirling disease is detected in Athabasca Rainbow Trout streams, it is prudent to manage the effects using information from studies on other strains of Rainbow Trout.
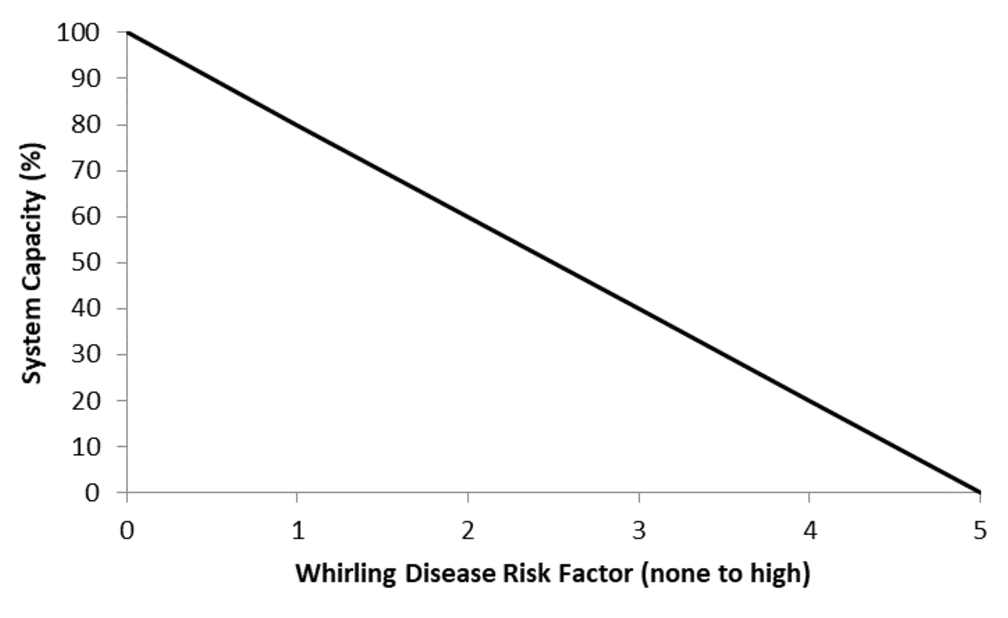
The stressor-response curve was derived from an Alberta trout age-class cohort model, using variable survival rates on juvenile trout (Sullivan and Spencer 2016). The population-level effects of whirling disease can be simulated at low, moderate or high levels of risk. This should be qualitatively determined using three factors; the prevalence of whirling disease in the watershed (low, moderate or high), the stream temperature (optimum of 10 0C– 150C mean warmest month = high risk, lower risk at cooler and warmer temperatures), and the gradient of the stream (low risk >4%, moderate risk 2 – 4%, high risk <2% gradient). This follows the Alberta risk assessment concepts for whirling disease (Paul and Reilly 2016). We expect that as Alberta biologists learn more about whirling disease and the key factors that influence its establishment and severity (e.g. Tubifex tubifex density, sediment type, water temperature etc.), and we have the input data to support inclusion within the Joe model, that this stressor-response curve will be refined.
The stressor-response curve was derived from an Alberta trout age-class cohort model, using variable survival rates on juvenile trout (Sullivan and Spencer 2016). The population-level effects of whirling disease can be simulated at low, moderate or high levels of risk. This should be qualitatively determined using three factors; the prevalence of whirling disease in the watershed (low, moderate or high), the stream temperature (optimum of 10 0C– 150C mean warmest month = high risk, lower risk at cooler and warmer temperatures), and the gradient of the stream (low risk >4%, moderate risk 2 – 4%, high risk <2% gradient). This follows the Alberta risk assessment concepts for whirling disease (Paul and Reilly 2016). We expect that as Alberta biologists learn more about whirling disease and the key factors that influence its establishment and severity (e.g. Tubifex tubifex density, sediment type, water temperature etc.), and we have the input data to support inclusion within the Joe model, that this stressor-response curve will be refined.
Function Derivation
Expert opinion
Transferability of Function
This function was developed for and applied to Athabasca Rainbow Trout. It was based on lines of evidence from risk assessment models for Alberta trout. Until more data is available to refine the curve, it should be used with caution.
Source of stressor Data
Mainly from studies on trout and char in other jurisdictions, modelled assessments and age-cohort models. No empirical studies on Athabasca Rainbow Trout and whirling disease are currently available (July 2017). This is a categorical variable, set to none (0) when whirling disease detection is negative (as distinct to “no testing for whirling disease”). The sensitivity of Athabasca Rainbow Trout to whirling disease is influenced by water temperature and water velocity. If whirling disease is detected in the Athabasca drainage, following Paul and Reilly (2016) the risk of whirling disease should be mapped in GIS along the stream network in the Athabasca drainage. For a given watershed, the whirling disease severity was ranked as the mean associated risk for a stream or river in the watershed. Using the mean (rather than the maximum) gives fisheries managers an estimate of the expected whirling disease risk in the overall watershed but does not account for the possibility of local ‘hot spots’ based on temperature or velocity. Disease severity can be adjusted according to local knowledge and updated laboratory results.
Function Type
continuous
Stressor Scale
linear
References Cited
Government of Alberta. 2024. Whirling disease stressor-response function for Athabasca Rainbow Trout. Environment and Protected Area Native Trout Cumulative Effects Model.
Baerwald, M.R., J.L. Petersen, R.P. Hedrick, G.J. Schisler and B. May. 2011. A major effect quantitative trait locus for whirling disease resistance identified in rainbow trout (Oncorhynchus mykiss). Heredity 106:920-926.
Nehring, R.B. and P.G. Walker. 1996. Whirling disease in the wild: the new reality in the intermountain west. Fisheries 21:28-30.
Paul, A.J. and J. Reilly. 2016. Whirling disease –risk mapping for the Bow River Basin. Technical report for Fisheries Management, Alberta Environment and Parks. Cochrane, AB. 1 Sept 2016. 14 pp.
Sullivan, M.G. and S. Spencer. 2016. Cumulative effect of whirling disease and fishing mortality on Alberta trout populations. Technical report, Fisheries Management, Alberta Environment and Parks. Edmonton, AB. 29 August 2016. 10 pp.
Vincent, E.R. 1996. Whirling disease and wild trout: the Montana experience. Fisheries 21:32-33.
File Upload
Images
Stressor Response csv data
Data_ARTR_whirlingDisease.csv
(152 bytes)
| Whirling Disease Risk | Mean System Capacity (%) | SD | low.limit | up.limit |
|---|---|---|---|---|
| 0 | 100 | 0 | 0 | 100 |
| 1 | 80 | 0 | 0 | 100 |
| 2 | 60 | 0 | 0 | 100 |
| 3 | 40 | 0 | 0 | 100 |
| 4 | 20 | 0 | 0 | 100 |
| 5 | 0 | 0 | 0 | 100 |
Stressor Response Chart
Mean Response
±1 Standard Deviation
Upper/Lower Limits