Selenium and Westslope Cutthroat Trout
mbakken
View all records in the stressor response library
Species Common Name
Westslope Cutthroat Trout
Latin Name (Genus species)
Oncorhynchus clarkii lewisi
Stressor Name
Selenium
Specific Stressor Metric
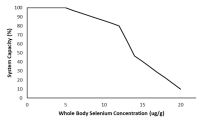
Whole body selenium concentration
Stressor Units
µg/g
Vital Rate (Process)
System capacity
Geography
Alberta foothills watersheds, excluding National Parks
Function Derivation
Based on data from Yellowstone Cutthroat Trout; Empirical data; Correlative model; Published (peer-reviewed)
Transferability of Function
This function was developed for and applied to Westslope Cutthroat Trout but was based on a population model for Yellowstone Cutthroat Trout (life history parameters measured in the Snake River). It should only be used on other subspecies of Cutthroat Trout with caution.
Source of stressor Data
Athabasca Rainbow Trout and Westslope Cutthroat Trout values at this time are set to 0 but it is our expectation that monitoring from industry will have taken place and whole-body tissue concentrations would be available.
Function Type
continuous
Stressor Scale
linear
References Cited
Government of Alberta. 2024. Selenium stressor-response function for Athabasca Rainbow Trout and Westslope Cutthroat Trout. Environment and Protected Area Native Trout Cumulative Effects Model.
Barceloux, D.G. 1999. Selenium. Clinical Toxicology 37: 145-172.
Fortin, B.L. 2010. Selenium dynamics in Canadian Rocky Mountain lakes. M.Sc. thesis, Department of Biological Sciences, University of Alberta. Edmonton, Alberta. 130 pp.
Frost, D.V., and P.M. Lish. 1975. Selenium in biology. Annual Review of Pharmacology 15: 259-284.
Hamilton, S.J., and R.H. Wiedmeyer. 1990. Concentrations of boron, molybdenum, and selenium in Chinook salmon. Transactions of the American Fisheries Society 119:500–510.
Hamilton, S.J., Palmisano, A.N., Wedemeyer, G.A., and W.T. Yasutake. 1986. Impacts of selenium on early life stages and smoltification of fall Chinook salmon. Transactions of North American Wildlife Natural Resources Conference 51:343-356.
Hardy, R.W., L.L. Oram, and G. Moller. 2010. Effects of dietary selenomethionine on cutthroat trout (Oncorhynchus clarki bouvieri) growth and reproductive performance over a life cycle. Archives of Environmental Contamination and Toxicology 58: 237-245.
Hodson, P.V., D.J. Spry, and B.R. Blunt. 1980. Effects on rainbow trout (Salmo gairdneri) of a chronic exposure to waterborne selenium. Canadian Journal Fisheries and Aquatic Science 37:233–240.
Kennedy, C.J., L.E. McDonald, R. Loveridge, and M.M. Strosher. 2000. The effect of bioaccumulated selenium on mortalities and deformities in the eggs, larvae, and fry of a wild population of cutthroat trout (Oncorhynchus clarkii lewisi). Archives of Environmental Contamination and Toxicology 39: 46-52.
Lemly A.D. 2004. Aquatic selenium pollution is a global environmental safety issue. Ecotoxicol Environ Saf. 59(1):44-56.
Palace, V.P., C. Baron, R.E. Evans, J. Holm, S. Kollar, K. Wautier, J. Werner, P. Siwik, G. Sterling, and C.F. Johnson. 2004. An assessment of the potential for selenium to impair reproduction in bull trout, Salvelinus confluentus, from an area of active coal mining. Environmental Biology of Fishes 70: 169-174.
Pilgrim, N.L. 2012. Multigenerational effects of selenium in rainbow trout, brook trout, and cutthroat trout. M.Sc. thesis, University of Lethbridge. Lethbridge, AB. 123 pp.
Sappington K.G. 2002. Development of aquatic life criteria for selenium: a regulatory perspective on critical issues and research needs. Aquatic Toxicology 57:101–113.
Van Kirk, R.W., and S.L. Hill. 2007. Demographic model predicts trout population response to selenium based on individual-level toxicity. Ecological Modelling 206:407-420.
Wang, Z., and Y. Gao, 2001. Biogeochemical cycling of selenium in Chinese environments. Applied Geochemistry 16: 1345-1351.
File Upload
Images

Stressor Response csv data
Data_WSCT_selenium.csv
(441 bytes)
| Selenium (µg/g whole body) | Mean System Capacity (%) | SD | low.limit | up.limit |
|---|---|---|---|---|
| 0 | 100 | 0 | 0 | 100 |
| 1 | 100 | 0 | 0 | 100 |
| 2 | 100 | 0 | 0 | 100 |
| 3 | 100 | 0 | 0 | 100 |
| 4 | 100 | 0 | 0 | 100 |
| 5 | 100 | 0 | 0 | 100 |
| 6 | 97.14284 | 0 | 0 | 100 |
| 7 | 94.2857 | 0 | 0 | 100 |
| 8 | 91.42856 | 0 | 0 | 100 |
| 9 | 88.57142 | 0 | 0 | 100 |
| 10 | 85.71428 | 0 | 0 | 100 |
| 11 | 82.85714 | 0 | 0 | 100 |
| 12 | 80 | 0 | 0 | 100 |
| 13 | 63.36 | 0 | 0 | 100 |
| 14 | 46.66 | 0 | 0 | 100 |
| 15 | 40.55 | 0 | 0 | 100 |
| 16 | 34.44 | 0 | 0 | 100 |
| 17 | 28.33 | 0 | 0 | 100 |
| 18 | 22.22 | 0 | 0 | 100 |
| 19 | 16.11 | 0 | 0 | 100 |
| 20 | 10 | 0 | 0 | 100 |
Stressor Response Chart
Mean Response
±1 Standard Deviation
Upper/Lower Limits