Substrate Cover and Nooksack Dace
mbakken
View all records in the stressor response library
Species Common Name
Nooksack Dace
Latin Name (Genus species)
Rhinichthys cataractae
Stressor Name
Substrate Cover
Specific Stressor Metric
Percent Cobble and Boulder Cover
Stressor Units
% Cobble and Boulder Cover
Vital Rate (Process)
System capacity
Geography
Lower Fraser Valley (British Columbia)
Detailed SR Function Description
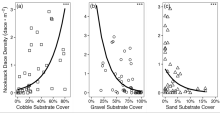
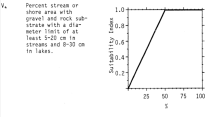
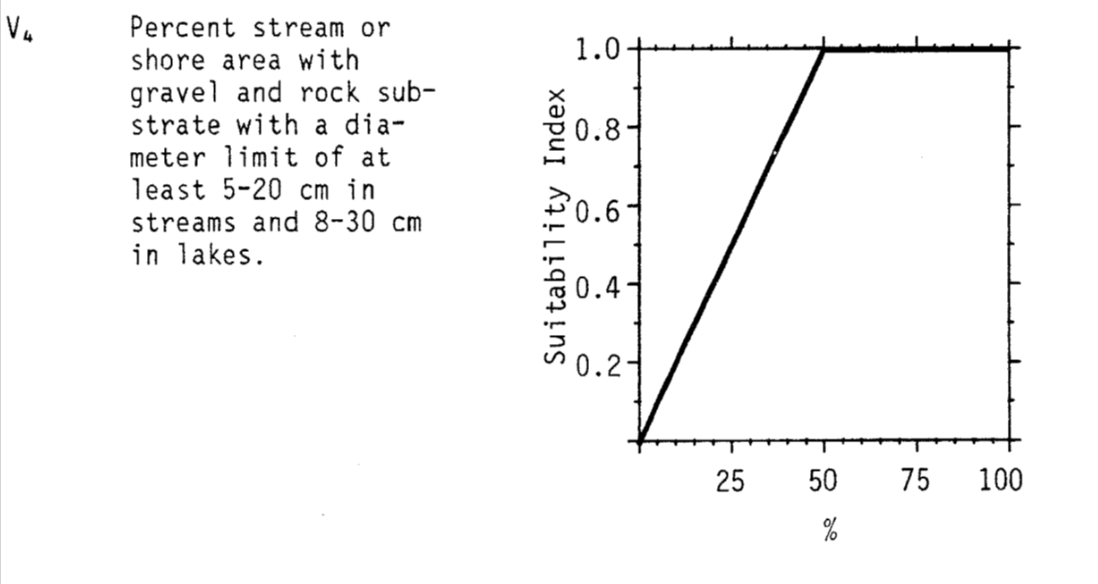
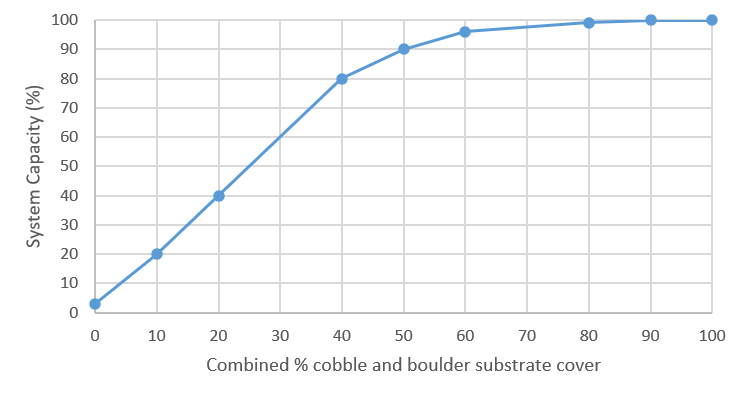
The final curve is largely based on the relationship between % cobble substrate cover and Nooksack Dace density identified in Gray et al. (2024) using empirical data (Fig. 1a below), supported by the habitat suitability curve for Longnose Dace (Edwards et al. 1983; Fig. 2), which also generally supports a positive association between % cobble cover and system capacity. However, we modified the density vs. % cobble curve from Gray et al. (2024) to increase the initial slope to make it closer to the Edwards et al. (1983) Longnose Dace curve. This was because almost no dace critical habitat reaches have the 80% cobble in riffle habitat required to achieve 100% capacity as predicted by the Gray et al. (2024) function (Fig. 1a). Even the best Bertrand Ck. high-density Nooksack Dace habitat (which we are using as the reference benchmark for 100% capacity) is in the range of 50-60% cobble cover, which is not consistent with the Gray et al. 2024 function, since we assume that high-density Bertrand Creek reaches represent a reference condition of 100% capacity. The final curve parameterization closer to the Edwards et al. curve ensures that current maximum dace densities are consistent with upper model predictions, while still allowing for increased cobble abundance to incrementally improve habitat. Note the large scatter of data in Gray et al. (2024) Figure 1a relationship broadly overlaps with both the fitted Gray et al. curve and the final SR function relationship. In addition, at the expert elicitation workshop held in November 2024, John Gray indicated that Dace may even prefer larger substrate (i.e. boulder) and that a SR function for boulder would be similar to the one for cobble. Therefore, for the x-axis of this SR function %cobble and boulder combined is more appropriate for more general application to streams/reaches that actually may have boulder-sized substrate present.
Function Derivation
Based on data from Longnose Dace and Nooksack Dace; Empirical data (correlative model); Published
Transferability of Function
As local adaptations are likely minimal among different Nooksack Dace populations, we would not expect much variation in true tolerance among populations. This function should therefore be broadly applicable to all populations of the species with caution.
Source of stressor Data
Percent cobble substrate data is available for most (but not all) reaches in Bertrand, Pepin, and Fishtrap Creeks collected as part of Pearson (2004) and subsequent field work to define critical habitat for Nooksack dace.
Function Type
continuous
Stressor Scale
linear
References Cited
Usoof, A.M. and Rosenfeld, J.S. 2024. Relationship between system capacity and Percent Cobble Substrate Cover for Nooksack Dace.
Gray, J., J. Rosenfeld, M. Pearson, K. Colletti, and J. Ross. 2024. The effect of riffle restoration on the recovery of endangered Nooksack Dace (Rhinichthys cataractae sp. cataractae). Facets 9:1–15.
Gray, J., J. Rosenfeld, M. Pearson, K. Colletti, and J. Ross. 2024. The effect of riffle restoration on the recovery of endangered Nooksack Dace (Rhinichthys cataractae sp. cataractae). Facets 9:1–15.
File Upload
Images

Stressor Response csv data
Data_ND_Substrate.csv
(222 bytes)
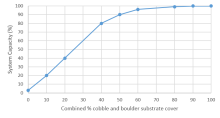
| % Cobble and boulder | Mean System Capacity (%) | SD | low.limit | up.limit |
|---|---|---|---|---|
| 0 | 3 | 0 | 0 | 100 |
| 10 | 20 | 0 | 0 | 100 |
| 20 | 40 | 0 | 0 | 100 |
| 40 | 80 | 0 | 0 | 100 |
| 50 | 90 | 0 | 0 | 100 |
| 60 | 96 | 0 | 0 | 100 |
| 80 | 99 | 0 | 0 | 100 |
| 90 | 100 | 0 | 0 | 100 |
| 100 | 100 | 0 | 0 | 100 |
| 100 | 100 | 0 | 0 | 100 |
Stressor Response Chart
Mean Response
±1 Standard Deviation
Upper/Lower Limits