Mean Annual Discharge and Atlantic Salmon
mbakken
View all records in the stressor response library
Species Common Name
Atlantic Salmon
Latin Name (Genus species)
Salmo salar
Stressor Name
Flow
Specific Stressor Metric
Mean Annual Discharge (MAD)
Stressor Units
%
Vital Rate (Process)
Density change (%)
Life Stage
Season
Winter
Geography
Catamaran Brook, NB, Canada
Detailed SR Function Description
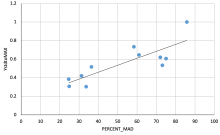
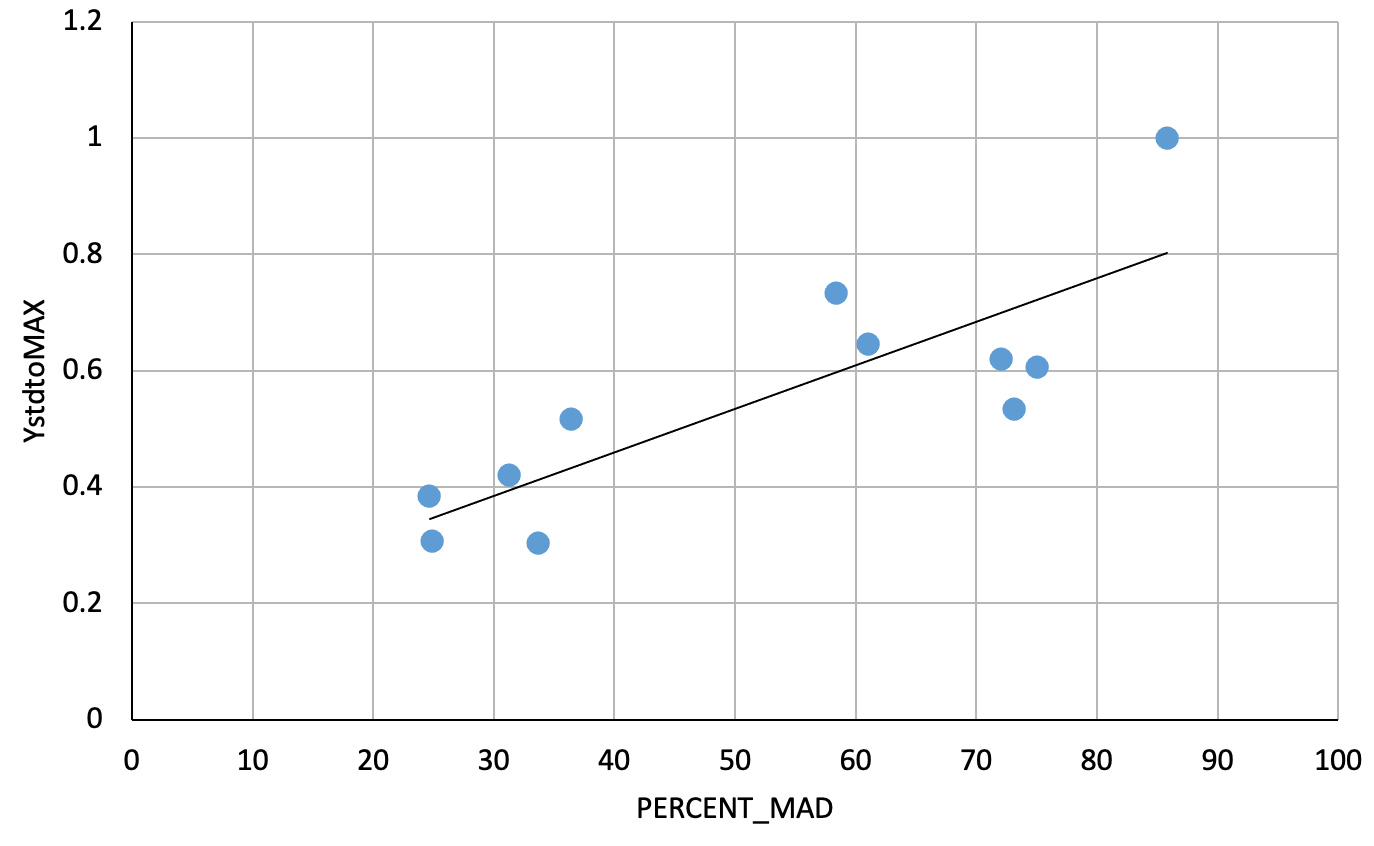
Final curve was derived from a linear regression.
System capacity was derived from seasonal electrofishing data which was available for 13 years (1990-2002) from 8 to 10 sites in the Lower Reach of Catamaran Brook. Fish abundance was then estimated using a multiple-sweep depletion method (Zippin, 1958) during annual electrofishing surveys in the summer and autumn.
To normalize and rescale each ecological response, each value was scaled by the maximum ecological response observed in the study such that mean habitat capacity percentage (normalized response) = response / maximum ecological response observed.
Implicit pathway of effect: Over-winter density decline of juvenile Atlantic salmon is reduced at higher average winter flows.
Function Derivation
Observational data. Final curve was derived from linear regression.
Transferability of Function
Appropriate for winter stream flow impacts on Atlantic Salmon juveniles. General transferability to other salmon stocks in unclear, but likely appropriate for other autumn-spawning salmonids (i.e., regions with similar hydrology to the Catamaran Brook).
The relationship may be unreliable if extrapolated to a flow range outside the original data (see the Average Salmonid flow-ecology SR function entry based on Rosenfeld and Enright (2025) for a more generalizable function across a wider range of flows).
The relationship may be unreliable if extrapolated to a flow range outside the original data (see the Average Salmonid flow-ecology SR function entry based on Rosenfeld and Enright (2025) for a more generalizable function across a wider range of flows).
Source of stressor Data
The winter streamflow data (discharge) for Catamaran Brook was collected using a streamflow gauging station located in the mid-basin. See methods of Cunjack et al. 2013 for details.
Data was then standardized by dividing absolute flow by MAD to achieve %MAD values (see Rosenfeld & Enright 2024). Such standardization allows for comparison of flow metrics across a wide range of stream sizes (see Rosenfeld et al. 2017).
Data was then standardized by dividing absolute flow by MAD to achieve %MAD values (see Rosenfeld & Enright 2024). Such standardization allows for comparison of flow metrics across a wide range of stream sizes (see Rosenfeld et al. 2017).
Function Type
continuous
Stressor Scale
linear
References Cited
Cunjak, R.A., Linnansaari, T., and Caissie, D. 2013. The complex interaction of ecology and
hydrology in a small catchment: a salmon's perspective. Hydrol. Process. 27: 741-749.
hydrology in a small catchment: a salmon's perspective. Hydrol. Process. 27: 741-749.
File Upload
Images
Stressor Response csv data
Data_Atlantic_Flow_Catamaran_Juv_0.csv
(413 bytes)
| PERCENT_MAD | Mean System Capacity (%) | SD | low.limit | up.limit |
|---|---|---|---|---|
| 24.67369231 | 34.6152692 | 0 | 0 | 100 |
| 24.86276923 | 34.7570769 | 0 | 0 | 100 |
| 31.22107692 | 39.5258077 | 0 | 0 | 100 |
| 33.62246154 | 41.3268462 | 0 | 0 | 100 |
| 36.42353846 | 43.4276538 | 0 | 0 | 100 |
| 58.38076923 | 59.8955769 | 0 | 0 | 100 |
| 60.97584615 | 61.8418846 | 0 | 0 | 100 |
| 72.04476923 | 70.1435769 | 0 | 0 | 100 |
| 73.09984615 | 70.9348846 | 0 | 0 | 100 |
| 75.02830769 | 72.3812308 | 0 | 0 | 100 |
| 85.82707692 | 80.4803077 | 0 | 0 | 100 |
Stressor Response Chart
Mean Response
±1 Standard Deviation
Upper/Lower Limits