Mean Annual Discharge and Steelhead
mbakken
View all records in the stressor response library
Species Common Name
Steelhead
Latin Name (Genus species)
Oncorhynchus mykiss irideus
Stressor Name
Flow
Specific Stressor Metric
Mean Annual Discharge (MAD)
Stressor Units
%
Vital Rate (Process)
Over-summer survival
Life Stage
Season
Summer
Geography
Maacama Creek, Mark West Creek, Santa Rosa Creek, Green Valley Creek. California, USA
Detailed SR Function Description
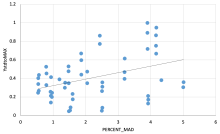
Final curve was derived from a linear regression.
System capacity was derived from oversummer survival with data spanning years 1994-2002. The original data points represent 50-55 sites yielding 523 observations where oversummer survival. Survival was estimated by sampling twice, in midsummer and late summer through repeated census counts using pole seins and blocking nets were used until no fish were captured (typically 3-5 passes) which were then sorted as species then counted. It was then subsetted to only include large catchments (90-120 sqkm).
To normalize and rescale each ecological response, each value was scaled by the maximum ecological response observed in the study such that mean habitat capacity percentage (normalized response) = response / maximum ecological response observed.
Note: Only used 75th percentile data in overall analysis because 10th percentile flows are extremely small
Implicit pathway of effect: Oversummer survival of juvenile steelhead increases with higher summer discharge
Function Derivation
Observational data. Final curve was derived from linear regression.
Transferability of Function
Appropriate for summer stream flow impacts on over-summer survival of juvenile steelhead. General transferability to other salmon stocks in unclear, but likely appropriate for other spring-spawning salmonids (i.e., regions with similar hydrology to the Maacama Creek, Mark West Creek, Santa Rosa Creek, Green Valley Creek system).
The relationship may be unreliable if extrapolated to a flow range outside the original data (see the Average Salmonid flow-ecology SR function entry based on Rosenfeld and Enright (2025) for a more generalizable function across a wider range of flows).
Note: This entry reflects only the subset including large catchments (90-120 sqkm), see other entries for other catchment sizes.
Source of stressor Data
The summer streamflow data (discharge) for each reach during the 9 years of sampling was estimated by the original authors (Grantham et al. 2012) based off a rain-fall run-off regression model based off of daily rainfall records. Data was sourced from the U.S. Geological Survey. Estimates was scaled by reach area. Estimates were later validated with measured flows at all sites with at least 12 measurements. See Grantham et al. 2012 for further details.
Data was then standardized by dividing absolute flow by MAD to achieve %MAD values (see Rosenfeld & Enright 2024). Such standardization allows for comparison of flow metrics across a wide range of stream sizes (see Rosenfeld et al. 2017).
Data was then standardized by dividing absolute flow by MAD to achieve %MAD values (see Rosenfeld & Enright 2024). Such standardization allows for comparison of flow metrics across a wide range of stream sizes (see Rosenfeld et al. 2017).
Function Type
continuous
Stressor Scale
linear
References Cited
Grantham, T.E., Newburn, D.A., McCarthy, M.A., and Merenlender, A.M. 2012. The role of streamflow and land use in limiting oversummer survival of juvenile steelhead in California streams. Trans. Am. Fish. Soc. 141:585-598.
File Upload
Images

Stressor Response csv data
Data_Steelhead_Flow_Cali_L_0.csv
(1.49 KB)
| PERCENT_MAD | Mean System Capacity (%) | SD | low.limit | up.limit |
|---|---|---|---|---|
| 0.53791 | 28.9807491 | 0 | 0 | 100 |
| 0.54323 | 29.0180423 | 0 | 0 | 100 |
| 0.54504 | 29.0307304 | 0 | 0 | 100 |
| 0.55888 | 29.1277488 | 0 | 0 | 100 |
| 0.56427 | 29.1655327 | 0 | 0 | 100 |
| 0.78606 | 30.7202806 | 0 | 0 | 100 |
| 0.78937 | 30.7434837 | 0 | 0 | 100 |
| 0.79821 | 30.8054521 | 0 | 0 | 100 |
| 0.92197 | 31.6730097 | 0 | 0 | 100 |
| 0.9271 | 31.708971 | 0 | 0 | 100 |
| 0.93066 | 31.7339266 | 0 | 0 | 100 |
| 0.93434 | 31.7597234 | 0 | 0 | 100 |
| 0.95858 | 31.9296458 | 0 | 0 | 100 |
| 0.96561 | 31.9789261 | 0 | 0 | 100 |
| 1.19094 | 33.5584894 | 0 | 0 | 100 |
| 1.36019 | 34.7449319 | 0 | 0 | 100 |
| 1.36897 | 34.8064797 | 0 | 0 | 100 |
| 1.47038 | 35.5173638 | 0 | 0 | 100 |
| 1.47382 | 35.5414782 | 0 | 0 | 100 |
| 1.4772 | 35.565172 | 0 | 0 | 100 |
| 1.48215 | 35.5998715 | 0 | 0 | 100 |
| 1.51707 | 35.8446607 | 0 | 0 | 100 |
| 1.53282 | 35.9550682 | 0 | 0 | 100 |
| 1.5958 | 36.396558 | 0 | 0 | 100 |
| 1.60272 | 36.4450672 | 0 | 0 | 100 |
| 1.86155 | 38.2594655 | 0 | 0 | 100 |
| 1.86497 | 38.2834397 | 0 | 0 | 100 |
| 1.86657 | 38.2946557 | 0 | 0 | 100 |
| 2.04641 | 39.5553341 | 0 | 0 | 100 |
| 2.04804 | 39.5667604 | 0 | 0 | 100 |
| 2.43258 | 42.2623858 | 0 | 0 | 100 |
| 2.43773 | 42.2984873 | 0 | 0 | 100 |
| 2.4999 | 42.734299 | 0 | 0 | 100 |
| 2.50359 | 42.7601659 | 0 | 0 | 100 |
| 2.50866 | 42.7957066 | 0 | 0 | 100 |
| 2.51062 | 42.8094462 | 0 | 0 | 100 |
| 2.5159 | 42.846459 | 0 | 0 | 100 |
| 3.19539 | 47.6096839 | 0 | 0 | 100 |
| 3.19766 | 47.6255966 | 0 | 0 | 100 |
| 3.2 | 47.642 | 0 | 0 | 100 |
| 3.89758 | 52.5320358 | 0 | 0 | 100 |
| 3.89968 | 52.5467568 | 0 | 0 | 100 |
| 3.90172 | 52.5610572 | 0 | 0 | 100 |
| 3.91877 | 52.6805777 | 0 | 0 | 100 |
| 3.91884 | 52.6810684 | 0 | 0 | 100 |
| 3.92541 | 52.7271241 | 0 | 0 | 100 |
| 4.16129 | 54.3806429 | 0 | 0 | 100 |
| 4.16359 | 54.3967659 | 0 | 0 | 100 |
| 4.16561 | 54.4109261 | 0 | 0 | 100 |
| 4.17467 | 54.4744367 | 0 | 0 | 100 |
| 4.3259 | 55.534559 | 0 | 0 | 100 |
| 5.00106 | 60.2674306 | 0 | 0 | 100 |
| 5.00991 | 60.3294691 | 0 | 0 | 100 |
Stressor Response Chart
Mean Response
±1 Standard Deviation
Upper/Lower Limits