Generic - Mean Annual Discharge
mbakken
View all records in the stressor response library

Species Common Name
Generic
Stressor Name
Flow
Specific Stressor Metric
Mean Annual Discharge
Stressor Units
%
Vital Rate (Process)
Habitat capacity
Geography
Generic
Detailed SR Function Description
This stressor-response function is the average function derived from a meta-analysis of 3X published studies on the response of salmonids to altered flows, including both observational studies and flow manipulation experiments...
Function Type
continuous
Stressor Scale
linear
References Cited
Jordan S Rosenfeld, Daniel Enright, Developing generalized flow ecology relationships for stream salmonids: Providing a clearer empirical basis for minimum flow regulations, Transactions of the American Fisheries Society, Volume 154, Issue 2, March 2025, Pages 162–178, https://doi.org/10.1093/tafafs/vnaf001
File Upload
Generic - MAD CEMPRA SR Function
(599.69 KB)
Rosenfeld & Enright 2025 - AFS
(965.33 KB)
Study Average Summary
(1.69 MB)
Images
Stressor Response csv data
Data_Generic_Flow_All.csv
(1.24 KB)
| PERCENT_MAD | Mean System Capacity (%) | SD | low.limit | up.limit |
|---|---|---|---|---|
| 0 | 0.16 | 0 | 0.13 | 0.2 |
| 4.52 | 0.31 | 0 | 0.27 | 0.34 |
| 10 | 0.51 | 0 | 0.39 | 0.64 |
| 12.58 | 0.61 | 0 | 0.43 | 0.81 |
| 13.23 | 0.63 | 0 | 0.45 | 0.81 |
| 13.55 | 0.63 | 0 | 0.47 | 0.82 |
| 20 | 0.69 | 0 | 0.53 | 0.86 |
| 27.1 | 0.75 | 0 | 0.59 | 0.92 |
| 33.23 | 0.8 | 0 | 0.64 | 0.97 |
| 40.65 | 0.86 | 0 | 0.7 | 1.03 |
| 46.77 | 0.91 | 0 | 0.76 | 1.09 |
| 56 | 1.006927099 | 0 | 0.7 | 1.18 |
| 60 | 0.984098123 | 0 | 0.68 | 1.22 |
| 62.26 | 0.968 | 0 | 0.67 | 1.25 |
| 69.68 | 0.93 | 0 | 0.64 | 1.33 |
| 70 | 0.928342013 | 0 | 0.64 | 1.32 |
| 74.84 | 0.9 | 0 | 0.61 | 1.29 |
| 80 | 0.874453815 | 0 | 0.58 | 1.26 |
| 88.39 | 0.829 | 0 | 0.54 | 1.21 |
| 90 | 0.822417598 | 0 | 0.53 | 1.2 |
| 94.19 | 0.8 | 0 | 0.51 | 1.185 |
| 100 | 0.772217149 | 0 | 0.48 | 1.16 |
| 103.23 | 0.755 | 0 | 0.47 | 1.15 |
| 110 | 0.723835956 | 0 | 0.43 | 1.125 |
| 111.29 | 0.7168 | 0 | 0.428 | 1.12 |
| 120 | 0.6772572 | 0 | 0.38 | 1.08 |
| 122.26 | 0.66687 | 0 | 0.365 | 1.075 |
| 130 | 0.632463735 | 0 | 0.33 | 1.05 |
| 133.87 | 0.615 | 0 | 0.315 | 1.04 |
| 140 | 0.589438075 | 0 | 0.29 | 1.02 |
| 150 | 0.548162375 | 0 | 0.25 | 0.985 |
| 160 | 0.508618412 | 0 | 0.21 | 0.96 |
| 170 | 0.470787568 | 0 | 0.18 | 0.94 |
| 180 | 0.434650801 | 0 | 0.15 | 0.92 |
| 190 | 0.400188627 | 0 | 0.12 | 0.9 |
| 200 | 0.367381088 | 0 | 0.09 | 0.88 |
| 225 | 0.28 | 0 | 0.051 | 0.83 |
| 250 | 0.215 | 0 | 0.028 | 0.78 |
| 275 | 0.165 | 0 | 0.01 | 0.735 |
| 300 | 0.125512713 | 0 | 0 | 0.69 |
| 325 | 0.09 | 0.65 | ||
| 350 | 0.06 | 0.61 | ||
| 375 | 0.04 | 0.575 | ||
| 400 | 0.021844698 | 0.54 | ||
| 425 | 0.015 | 0.5025 | ||
| 450 | 0.01 | 0.465 | ||
| 475 | 0.006 | 0.43 | ||
| 500 | 0 | 0.4 | ||
| 600 | 0.29 | |||
| 700 | 0.21 |
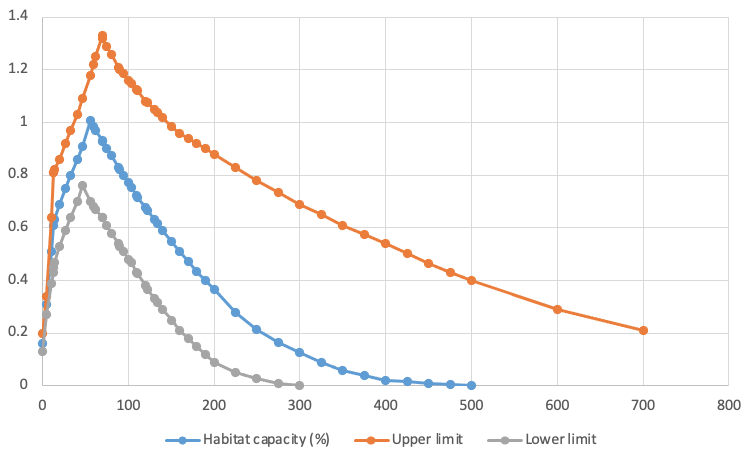
Stressor Response Chart
Mean Response
±1 Standard Deviation
Upper/Lower Limits