August Minimum 6 hr Dissolved Oxygen and Nooksack Dace/Salish Sucker
jrosenfeld
View all records in the stressor response library
Species Common Name
Nooksack Dace/Salish Sucker
Latin Name (Genus species)
Rhinichthys cataractae sp. cataractae/Catastomus sp.
Stressor Name
August Minimum 6 hr Dissolved Oxygen
Specific Stressor Metric
The lowest Dissolved Oxygen averaged across a 6 hour moving window for the month of August
Stressor Units
mg/L (= ppm)
Vital Rate (Process)
Survival
Geography
Lower Fraser Valley (British Columbia), Washington State (US)
Detailed SR Function Description
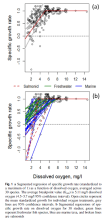
The general effects of DO on system capacity via sub-lethal growth impacts were inferred based on a meta-analysis examining the effect of Dissolved Oxygen (DO) concentration on specific growth rate of fish, which evaluated data from 38 studies on 30 freshwater and marine species (Rosenfeld and Lee 2022), and is represented by the "August Mean Dissolved Oxygen and Nooksack Dace" Stressor Response function. However, low dissolved oxygen can also cause direct mortality, and this stressor response function captures those lethal effects separately. Lethal effects of DO are treated as independent of sub-lethal growth effects, which operate largely independently, i.e. sublethal effects can operate to reduce growth independent of higher mortality rates that will occur at lower DO levels. Because the studies used to generate this current SR function (Saari et al. 2018, Miller et al. 2002) are based on short-term mortality effects of low DO, it is empirically independent of growth effects. Although low growth may increase the likelihood of mortality, that effect is not accounted for here, meaning that this SR function may be somewhat biased towards underestimating the lethal effects of low DO.
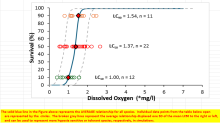
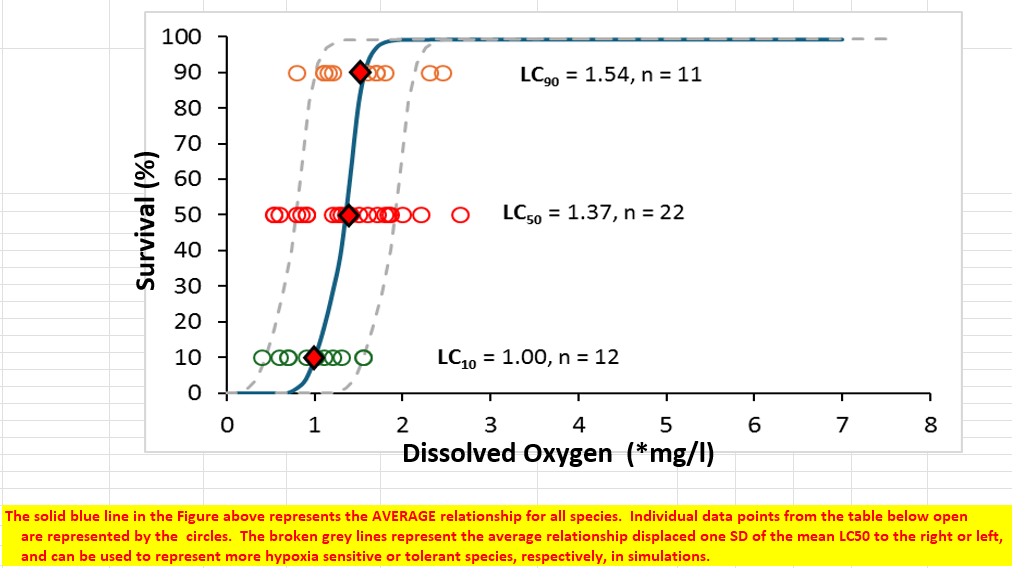
The information below is largely extracted from the attached data file "Data_SS-ND_ MinimumDO_SysCapacity JUNE 2026.xls" (the more detailed Word documentation remains to be written up). This SR function for mortality effects of low DO (hypoxia) was developed based on data from Saari et al. (2018), who estimated average survival of fish (in terms of LC50, the concentration of DO that caused 50% mortality within 48 hours of exposure) based on a literature review of published studies including 9 species of freshwater fish, and LC50 from an additional 12 species of marine fish were extracted from Miller et al. (2002). Miller et al. (2002) also included estimates of LC10 and LC50, which allowed generation of a more complete stressor-response function for survival as a logistic growth-type curve. All replicate estimates of LC50, LC10, or LC90 for the same species (or life stage within a species) were combined to generate a species average LC value to avoid pseudo-replication, i.e. each species was weighted equally with a sample size of one to generate a total sample size of n = 22 LC50 estimates for 22 species, and 11 and 12 replicates for LC90 and LC10, respectively (see the full data set embedded in the attached Excel file). System (habitat) capacity effects are estimated based on the modelled change in LC50 with declining DO, i.e. increasing mortality at lower DO levels. Note that this mortality effect of decreasing DO is considered independent of the effect of decreasing DO on growth, which is captured in a separate growth SR function as noted above.
The survival function is assumed to follow a typical logistic curve through the mean LC50 for all fish species of 1.39 mg/l DO. Note that this is slightly higher than the geometric mean value of 1.26 reported by Saari et al. (2018), partly because of the additional marine fish data but also because we use a simple arithmetic mean; there was no meaningful difference between the median and mean values, indicating minimally skewed data so a geometric mean was not warranted. A logistic growth function was fit to the data using the nlme function in R (see R code in the attached "Data_SS-ND_ MinimumDO_SysCapacity JUNE 2026.xls" data file).
This generic mortality function is not based on direct measures of DO survival effects on Nooksack dace or Salish sucker, which would not be possible given their endangered status and animal care constraints. Although the data come from a relatively small but diverse sample size of 22 fish species, it is the best data available to infer the probable effects of hypoxia on survival of data-deficient fish species like Nooksack dace and Salish sucker. In addition, the variation among species is relatively low, i.e. the absolute difference in LC50 between the most sensitive and tolerant species is only 2.12 mg/l, which is far lower than the range in thresholds for growth reduction (sublethal effects) across species.
The specific metric of DO (the stressor) chosen as the x-axis of the SR function was the minimum average DO for a 6 hour moving window observed in the month of August. Shorter duration DO metrics (such as minimum instantaneous DO) were not chosen because a short transient exposure might be insufficient to cause mortality. Similarly, longer integrated DO metrics, such as minimum 24 hour average (daily) DO were also not used because high diel variation in DO (e.g., associated with peak daytime photosynthesis) means that average daily DO might be moderate, but mask night-time hypoxia that could be within a lethal range for multiple hours. Consequently, minimum average DO over a 6-hour moving average time integration window was chosen, because this length of exposure is high enough to cause mortality, but short enough to capture nocturnal lows without including day-time highs associated with primary production. Although LC50 assays generally expose fish to hypoxia over 48 hours duration, Landman et al. (2005) note that mortality from hypoxia in LC50 trials "…occurred very rapidly, and did not generally continue after 48 hr." A 6 hour window for characterizing DO therefore seems reasonable for inferring mortality effects.
A larger source of uncertainty in application of this function likely relates to the stressor magnitude estimate. Typically a single value of DO is used to characterize a reach or spatial unit. Prediction of mortality at the specified oxygen concentration assumes relative homogeneity in stressor levels within the spatial unit, and the absence of a well-oxygenated refuge. This is a significant assumption, and highlights the importance of understanding the spatial variation in stressor levels. However, it is a general concern that relates to temperature and any other stressor (e.g. the absence of thermal refuges is implicit when using a single temperature value in a spatial unit).
Function Derivation
Based on data from other species; Empirical data (experimental manipulations); Published
Transferability of Function
As local adaptations are likely minimal among different Nooksack Dace populations, we would not expect much variation in true lethal effects of DO among populations. This function should therefore be broadly applicable to all populations of the species, with the caveat that it is based on generic data from other species.
Source of stressor Data
In the absence of empirical DO data (e.g. a continuous trace of DO at a site), a predictive model to estimate 6 hr minimum Aug. DO as a function of temperature, flow, and associated covariates has been generated to create the dissolved oxygen stressor magnitude dataset for Lower Fraser Valley streams. This STRESSOR ESTIMATION FUNCTION has been generated using data from Ramirez et al. (2024, M.Sc. thesis UBC), and is available in this SR Function Library by searching for "August Minimum 6-hour Dissolved Oxygen Stressor Estimation Function".
Function Type
continuous
Stressor Scale
linear
References Cited
Michael J. Landman , Michael R. Van Den Heuvel & Nicholas Ling. (2005) Relative sensitivities of common freshwater fish and invertebrates to acute hypoxia, New Zealand Journal of Marine and Freshwater Research, 39:5, 1061-1067, DOI: 10.1080/00288330.2005.9517375
D.C. Miller, S.L. Poucher, and L. Coiro. 2002. Determination of lethal dissolved oxygen levels for selected marine and estuarine fishes, crustaceans, and a bivalve. Marine Biology 140: 287-296. DOI 10.1007/s002270100702
Rosenfeld, J.S., and Lee, R. 2022. Thresholds for Reduction in Fish Growth and Consumption Due to Hypoxia: Implications for Water Quality Guidelines to Protect Aquatic Life. Environmental Management https://doi.org/10.1007/s00267-022-01678-9
G. N. Saari, Z. Wang, B. W. Brooks, Revisiting inland hypoxia: diverse exceedances of dissolved oxygen thresholds for freshwater aquatic life. Environ. Sci. Pollut. Res. 25, 3139–3150 (2018).
Usoof, A.M. and Rosenfeld, J.S. 2024. Relationship between system capacity and Dissolved Oxygen concentration for Nooksack Dace.
Ramirez, Samantha. 2024. MODELLING THE IMPACT OF HUMAN DEVELOPMENT AND WATER QUALITY ON HYPOXIA. UBC Masters thesis, UBC Institute for the Oceans and Fisheries.
File Upload
Saari et al. 2018 REVISTING INLAND HYPOXIA
(560.48 KB)
Images

Stressor Response csv data
ND-SS Minimum 6hr DO_2026.csv
(502 bytes)
| DO (mg/L) | Mean System Capacity (%) | SD | low.limit | up.limit |
|---|---|---|---|---|
| 0.00 | 0.00 | 0.00 | 0 | 100 |
| 0.60 | 0.02 | 0.06 | 0 | 100 |
| 0.80 | 0.16 | 0.37 | 0 | 100 |
| 1.00 | 1.42 | 2.53 | 0 | 100 |
| 1.10 | 4.10 | 6.10 | 0 | 100 |
| 1.20 | 11.25 | 11.71 | 0 | 100 |
| 1.30 | 27.33 | 17.57 | 0 | 100 |
| 1.35 | 39.30 | 19.11 | 0 | 100 |
| 1.40 | 52.71 | 19.47 | 0 | 100 |
| 1.50 | 76.77 | 16.97 | 0 | 100 |
| 1.60 | 90.74 | 11.33 | 0 | 100 |
| 1.70 | 96.67 | 6.13 | 0 | 100 |
| 1.80 | 98.85 | 2.95 | 0 | 100 |
| 2.00 | 99.87 | 1.02 | 0 | 100 |
| 2.20 | 99.98 | 0.38 | 0 | 100 |
| 2.45 | 100.00 | 0.00 | 0 | 100 |
| 5.00 | 100.00 | 0.00 | 0 | 100 |
| 10.00 | 100.00 | 0.00 | 0 | 100 |
| 14.00 | 100.00 | 0.00 | 0 | 100 |
Stressor Response Chart
Mean Response
±1 Standard Deviation
Upper/Lower Limits