Percent Riffle in Reach and Nooksack Dace
mbakken
View all records in the stressor response library
Species Common Name
Nooksack Dace
Latin Name (Genus species)
Rhinichthys cataractae
Stressor Name
Riffle
Specific Stressor Metric
Riffle in reach
Stressor Units
% of riffle in reach
Vital Rate (Process)
System capacity
Geography
Lower Fraser Valley (British Columbia)
Detailed SR Function Description
The shape and threshold for the final curve is based on Pearson et al. (2007) and Pearson (2004), which shows a large decline in percent reaches occupied by Nooksack Dace when the percent riffle in a reach in below 5-10% (Figure 1). The definition of Critical Habitat for Nooksack Dace includes reaches that are greater than 10% riffle, because reaches with less than 10% riffle tend to have lower riffle occupancy, presumably because the less hospitable habitat between riffles (i.e., low suitability pool habitat) reduces the likelihood of the overall reach supporting a local dace population. Occupancy drops noticeably at 5% riffle, and then approaches zero occupancy at 0% riffle (see Fig. 2 below). However, the logic that reaches above 10% riffle have equivalent habitat capacity - implicit in the plateau at a habitat suitability of 1 in the Edwards et al. (1983) habitat suitability curve (Fig. 2), and Pearson 2007 (Fig. 1) is flawed. Logically, the abundance of dace should be directly proportional to riffle area in a reach (i.e. % riffle), all else being equal. This means that there should be a linear relationships between % riffle and habitat capacity, i.e. a direct 1:1 relationship, rather than the direct implication of the Edwards et al. line that dace abundance is equal in reaches ranging from 25-80% riffle, which is somewhat nonsensical.
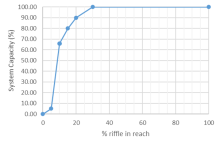
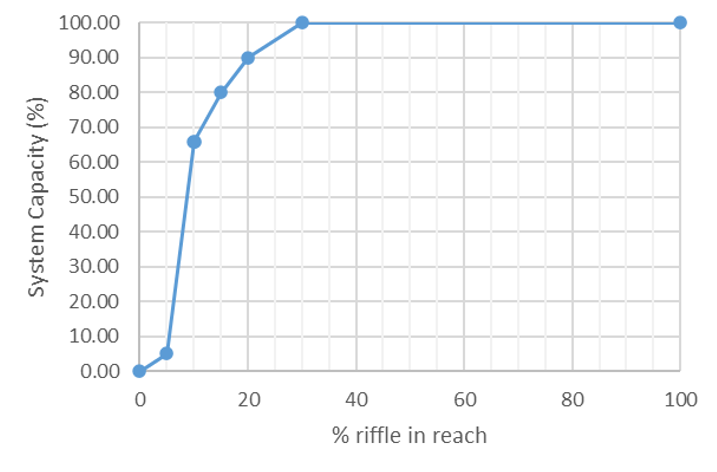
The SR function has therefore been altered so that habitat capacity (relative dace abundance) is zero at 0% riffle, increases steeply from 5% to 10% riffle at the reach scale, and then at a reduced rate at higher riffle abundance until it plateaus at 100% capacity at 30% riffle. 100% capacity (the plateau breakpoint) was not set at 80% or 100% riffle because the low gradient of most Nooksack Dace reaches (aside from in the Brunette River) means that achieving more than 25-30% riffle would be geomorphically impossible. In addition, the highest reference densities of dace occur in Bertrand Creek which has a maximum % riffle in the range of 30%; setting 100% capacity at 30% riffle therefor ensures that current maximum capacity will be achieved in the reaches with maximum possible % riffle. This is broadly realistic, because some reaches in Bertrand creek with ~15% riffle currently support healthy populations of dace, and the steep slope between 5-15% riffle will allow for rapidly increased carrying capacity over this range. While the curve allows for increase capacity at a higher proportion of riffle habitat up to 30%, the incremental benefits are likely lower. NOTE, however, that this SR function only applies to "Joe" model applications with relative habitat capacity where the reference state is set at 100% capacity (in this case, corresponding to 30% riffle). If dace abundance is being directly estimated based on the product of maximum density and wetted area of the reach, then the relationship between % riffle habitat and habitat capacity (or population size) should be treated as linear in direct calculation of population abundance.
The SR function has therefore been altered so that habitat capacity (relative dace abundance) is zero at 0% riffle, increases steeply from 5% to 10% riffle at the reach scale, and then at a reduced rate at higher riffle abundance until it plateaus at 100% capacity at 30% riffle. 100% capacity (the plateau breakpoint) was not set at 80% or 100% riffle because the low gradient of most Nooksack Dace reaches (aside from in the Brunette River) means that achieving more than 25-30% riffle would be geomorphically impossible. In addition, the highest reference densities of dace occur in Bertrand Creek which has a maximum % riffle in the range of 30%; setting 100% capacity at 30% riffle therefor ensures that current maximum capacity will be achieved in the reaches with maximum possible % riffle. This is broadly realistic, because some reaches in Bertrand creek with ~15% riffle currently support healthy populations of dace, and the steep slope between 5-15% riffle will allow for rapidly increased carrying capacity over this range. While the curve allows for increase capacity at a higher proportion of riffle habitat up to 30%, the incremental benefits are likely lower. NOTE, however, that this SR function only applies to "Joe" model applications with relative habitat capacity where the reference state is set at 100% capacity (in this case, corresponding to 30% riffle). If dace abundance is being directly estimated based on the product of maximum density and wetted area of the reach, then the relationship between % riffle habitat and habitat capacity (or population size) should be treated as linear in direct calculation of population abundance.
Function Derivation
Based on data from Nooksack Dace and Longnose Dace; Empircal data (Correlative model); Published; Expert opinion
Transferability of Function
As local adaptations are likely minimal among different Nooksack Dace populations, we would not expect much variation in true tolerance among populations. This function should therefore be broadly applicable to all populations of the species with caution.
Source of stressor Data
Percent riffle data is available for most (but not all) reaches in Bertrand, Pepin, and Fishtrap Creeks, collected as part of Pearson (2004) and subsequent field work to define critical habitat for Nooksack dace.
Function Type
continuous
Stressor Scale
linear
References Cited
Usoof, A.M. and Rosenfeld, J.S. 2024. Relationship between system capacity and Percent Riffle in Reach for Nooksack Dace.
Edwards, E. A., H. Li, and C. B. Schreck. 1983. Habitat Suitability Index Models: Longnose Dace. U.S. Dept. Int., FishWildl. Serv. FWS/OBS-82/10.33.
Pearson, M. P. 2004. The ecology, status and recovery prospects of Noonsack dace (Rhinichthys Cataractae ssp.) and Salish sucker (Catostomus sp.) in Canada. University of British Columbia.
Pearson, M. P., T. Hatfield, J. D. McPhail, J. S. Richardson, J. S. Rosenfeld, H. Schreier, D. Schluter, D. J. Sneep, M. Stejpovic, E. B. Taylor, and P. M. Wood. 2007. Recovery Strategy for the Nooksack Dace ( Rhinichthys cataractae) in Canada. Species at. Fisheries and Oceans Canada, Vancouver B.C.
File Upload
Images
Stressor Response csv data
Data_ND_PercentRiffle.csv
(212 bytes)
| Percent Riffle | System capacity (%) | SD | low.limit | up.limit |
|---|---|---|---|---|
| 0.00 | 0.00 | 0 | 0 | 100 |
| 5 | 5 | 0 | 0 | 100 |
| 10.00 | 66.00 | 0 | 0 | 100 |
| 10.1 | 66.00 | 0 | 0 | 100 |
| 15.00 | 80.00 | 0 | 0 | 100 |
| 20.00 | 90.00 | 0 | 0 | 100 |
| 30.00 | 100.00 | 0 | 0 | 100 |
| 100 | 100 | 0 | 0 | 100 |
Stressor Response Chart
Mean Response
±1 Standard Deviation
Upper/Lower Limits