Temperature and Rainbow Trout Growth Rate
stobias
View all records in the stressor response library
Species Common Name
Rainbow Trout
Latin Name (Genus species)
Oncorhynchus mykiss
Stressor Name
Temperature
Specific Stressor Metric
Tank Temperature
Stressor Units
°C
Vital Rate (Process)
Growth
Life Stage
Detailed SR Function Description
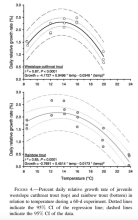
Percent daily relative growth rate of juvenile westslope cutthroat trout in relation to temperature during a 60-d experiment.
In this laboratory experiment, Rainbow trout were obtained as eggs from the Ennis National Fish Hatchery near Ennis, Montana.
Growth formula is as follows:
Growth = -0.7691 + 0.4514 * temp - 0.0173 * (temp)^2
Scaled from the original curve so that the highest upper limit value equals to 100%.
In this laboratory experiment, Rainbow trout were obtained as eggs from the Ennis National Fish Hatchery near Ennis, Montana.
Growth formula is as follows:
Growth = -0.7691 + 0.4514 * temp - 0.0173 * (temp)^2
Scaled from the original curve so that the highest upper limit value equals to 100%.
Function Derivation
laboratory experiment
Function Type
continuous
Stressor Scale
linear
References Cited
Bear, E. A., McMahon, T. E., & Zale, A. V. (2007). Comparative thermal requirements of westslope cutthroat trout and rainbow trout: implications for species interactions and development of thermal protection standards. Transactions of the American Fisheries Society, 136(4), 1118.
Citation Link
File Upload
Excel file graphing the provided formula
(145.27 KB)
Stressor Response csv data
Bear et al 4. Rainbow trout_0.csv
(891 bytes)
| Stressor (X) | Mean System Capacity (%) | SD | low.limit | up.limit |
|---|---|---|---|---|
| 8 | 59.6185567 | 12.02749141 | 32.64604811 | 85.91065292 |
| 9 | 65.02405498 | 12.37113402 | 37.80068729 | 90.37800687 |
| 10 | 69.24054983 | 10.30927835 | 41.92439863 | 96.56357388 |
| 11 | 72.26804124 | 8.591065292 | 46.04810997 | 97.93814433 |
| 12 | 74.10652921 | 8.591065292 | 48.79725086 | 100 |
| 13 | 74.75601375 | 8.934707904 | 49.48453608 | 100 |
| 14 | 74.21649485 | 7.903780069 | 49.14089347 | 100 |
| 15 | 72.48797251 | 6.872852234 | 48.10996564 | 97.93814433 |
| 16 | 69.57044674 | 8.24742268 | 44.32989691 | 94.84536082 |
| 17 | 65.46391753 | 7.903780069 | 42.26804124 | 91.75257732 |
| 18 | 60.16838488 | 10.30927835 | 34.36426117 | 83.16151203 |
| 19 | 53.6838488 | 7.216494845 | 29.89690722 | 78.35051546 |
| 20 | 46.01030928 | 12.02749141 | 22.33676976 | 73.5395189 |
| 21 | 37.14776632 | 9.621993127 | 11.6838488 | 65.29209622 |
| 22 | 27.09621993 | 13.74570447 | 1.374570447 | 55.32646048 |
| 23 | 15.8556701 | 14.08934708 | 0 | 44.32989691 |
| 24 | 3.426116838 | 10.99656357 | 0 | 29.89690722 |
Stressor Response Chart
Mean Response
±1 Standard Deviation
Upper/Lower Limits

