Dissolved Oxygen and Nooksack Dace
jrosenfeld
View all records in the stressor response library
Species Common Name
Nooksack Dace
Latin Name (Genus species)
Rhinichthys cataractae sp. cataractae
Stressor Name
Dissolved Oxygen
Stressor Units
mg/L (= ppm)
Vital Rate (Process)
Growth
Geography
Lower Fraser Valley (British Columbia), Washington State (US)
Detailed SR Function Description
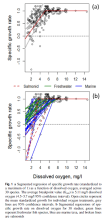
The effects of DO on system capacity was inferred based on a meta-analysis examining the effect of Dissolved Oxygen (DO) concentration on specific growth rate of fish, which evaluated data from 38 studies on 30 freshwater and marine species (Rosenfeld and Lee 2022). The shape of the curve and threshold value (5.1 mg/L) is based on segmented regression of specific growth rate as a function of dissolved oxygen averaged across 30 species. The inference implicit in using growth as the response variable is that threshold effects of low DO on individual growth will be similar to population-level effects. Although the average segmented regression across all species is highly significant and the threshold or 5.1 mg/L is consistent with previous analyses and regulatory guidelines for water quality, it should be noted that there remains great inter-specific variation around the mean response. Some species are relatively insensitive to hypoxia, particularly warmwater species, and others (particularly coolwater species and salmonids) showing higher sensitivity (see Fig. 1 below from Rosenfeld and Lee 2022).
We initially assumed that Nooksack dace would be relatively sensitive to low oxygen, as they are a riffle-dwelling species that occupy turbulent and well-oxygenated habitat. Consequently, our initial inference was to assign then the same sensitivity to reduced oxygen as salmonids, which have a relatively steeper decline in growth with reduced DO than the average for all species (Rosenfeld and Lee 2022, see Fig. 1b below). However, during sampling for fish in Aug. 2024 we made an observation which suggests that they are not as sensitive as salmonids. During a fish salvage in Pepin Creek, we placed 2 Nooksack dace in a 4l bucket along with one juvenile coho and 3 juvenile cutthroat trout (young-of-the-year). It was a warm day, and we inadvertently forgot about the bucket which was placed on the stream bank. When we checked up on it after an hour, the three yoy trout had asphyxiated, but the coho and the 2 dace were fine, and showed no sign of harm when held in the creek in a flow-through bin before release. This indicates that Nooksack dace are likely more tolerant of hypoxia than trout, despite being adapted to fast-water habitat, and we therefore used the average growth reduction vs. dissolved oxygen regression in Rosenfeld and Lee (2022; see their Fig. 1a below) as the stressor-response function for dissolved oxygen.
We initially assumed that Nooksack dace would be relatively sensitive to low oxygen, as they are a riffle-dwelling species that occupy turbulent and well-oxygenated habitat. Consequently, our initial inference was to assign then the same sensitivity to reduced oxygen as salmonids, which have a relatively steeper decline in growth with reduced DO than the average for all species (Rosenfeld and Lee 2022, see Fig. 1b below). However, during sampling for fish in Aug. 2024 we made an observation which suggests that they are not as sensitive as salmonids. During a fish salvage in Pepin Creek, we placed 2 Nooksack dace in a 4l bucket along with one juvenile coho and 3 juvenile cutthroat trout (young-of-the-year). It was a warm day, and we inadvertently forgot about the bucket which was placed on the stream bank. When we checked up on it after an hour, the three yoy trout had asphyxiated, but the coho and the 2 dace were fine, and showed no sign of harm when held in the creek in a flow-through bin before release. This indicates that Nooksack dace are likely more tolerant of hypoxia than trout, despite being adapted to fast-water habitat, and we therefore used the average growth reduction vs. dissolved oxygen regression in Rosenfeld and Lee (2022; see their Fig. 1a below) as the stressor-response function for dissolved oxygen.
Function Derivation
Based on data from other species; Empirical data (experimental manipulation); Published
Transferability of Function
As local adaptations are likely minimal among different Nooksack Dace populations, we would not expect much variation in true tolerance among populations. This function should therefore be broadly applicable to all populations of the species, with the caveat that it is based on generic data from other species.
Source of stressor Data
DO data is available for several reaches in Bertrand, Pepin, Fishtrap Creeks, and the Salmon River, collected as part of reconnaissance surveys to assess fish distribution, monitoring associated with habitat restoration, and mark–recapture population assessments that took place between 2003 and 2018. A predictive model to estimate DO as a function of temperature, flow, and associated covariates will need to be generated to create the dissolved oxygen stressor dataset.
Function Type
continuous
Stressor Scale
linear
References Cited
Rosenfeld, J.S., and Lee, R. 2022. Thresholds for Reduction in Fish Growth and Consumption Due to Hypoxia: Implications for Water Quality Guidelines to Protect Aquatic Life. Environmental Management https://doi.org/10.1007/s00267-022-01678-9
Usoof, A.M. and Rosenfeld, J.S. 2024. Relationship between system capacity and Dissolved Oxygen concentration for Nooksack Dace.
SR Excel function for CEMPRA input
Usoof, A.M. and Rosenfeld, J.S. 2024. Relationship between system capacity and Dissolved Oxygen concentration for Nooksack Dace.
SR Excel function for CEMPRA input
Images

Stressor Response csv data
Data_ND_DO.csv
(241 bytes)
| DO (mg/L) | Mean System Capacity (%) | SD | low.limit | up.limit |
|---|---|---|---|---|
| 0 | 0 | 0 | 0 | 100 |
| 0.8 | 0 | 0 | 0 | 100 |
| 5.1 | 100 | 0 | 0 | 100 |
| 6 | 100 | 0 | 0 | 100 |
| 7 | 100 | 0 | 0 | 100 |
| 8 | 100 | 0 | 0 | 100 |
| 9 | 100 | 0 | 0 | 100 |
| 10 | 100 | 0 | 0 | 100 |
| 11 | 100 | 0 | 0 | 100 |
| 12 | 100 | 0 | 0 | 100 |
| 13 | 100 | 0 | 0 | 100 |
| 14 | 100 | 0 | 0 | 100 |
Stressor Response Chart
Mean Response
±1 Standard Deviation
Upper/Lower Limits