Jensen 2009: Fine Sediments and Coho Salmon
mbakken
View all records in the stressor response library

Species Common Name
Coho Salmon
Latin Name (Genus species)
Oncorhynchus kisutch
Stressor Name
Sedimentation
Specific Stressor Metric
Fine sediments
Stressor Units
% fines (0.85mm)
Vital Rate (Process)
Survivorship
Geography
Pacific Northwest Freshwater Systems, USA
Function Type
continuous
Stressor Scale
linear
References Cited
Jensen, D.W., Steel, E.A., Fullerton, A.H. and Pess, G.R., 2009. Impact of fine sediment on egg-to-fry survival of Pacific salmon: a meta-analysis of published studies. Reviews in Fisheries Science, 17(3), pp.348-359.
File Upload
Images
Stressor Response csv data
Data_Coho_Fines_PNW.csv
(1.26 KB)
| PERCENT_FINES_0.85mm | Mean System Capacity (%) | SD | low.limit | up.limit |
|---|---|---|---|---|
| 0 | 73.16 | 3.4 | 0 | 100 |
| 1 | 70.92 | 3.41 | 0 | 100 |
| 2 | 68.58 | 3.41 | 0 | 100 |
| 3 | 66.13 | 3.38 | 0 | 100 |
| 4 | 63.59 | 3.33 | 0 | 100 |
| 5 | 60.96 | 3.27 | 0 | 100 |
| 6 | 58.27 | 3.19 | 0 | 100 |
| 7 | 55.53 | 3.1 | 0 | 100 |
| 8 | 52.75 | 3 | 0 | 100 |
| 9 | 49.96 | 2.89 | 0 | 100 |
| 10 | 47.16 | 2.79 | 0 | 100 |
| 11 | 44.38 | 2.69 | 0 | 100 |
| 12 | 41.63 | 2.59 | 0 | 100 |
| 13 | 38.93 | 2.51 | 0 | 100 |
| 14 | 36.3 | 2.43 | 0 | 100 |
| 15 | 33.75 | 2.36 | 0 | 100 |
| 16 | 31.3 | 2.3 | 0 | 100 |
| 17 | 28.94 | 2.25 | 0 | 100 |
| 18 | 26.69 | 2.2 | 0 | 100 |
| 19 | 24.56 | 2.16 | 0 | 100 |
| 20 | 22.55 | 2.11 | 0 | 100 |
| 21 | 20.66 | 2.07 | 0 | 100 |
| 22 | 18.89 | 2.02 | 0 | 100 |
| 23 | 17.24 | 1.97 | 0 | 100 |
| 24 | 15.7 | 1.92 | 0 | 100 |
| 25 | 14.28 | 1.86 | 0 | 100 |
| 26 | 12.98 | 1.8 | 0 | 100 |
| 27 | 11.77 | 1.74 | 0 | 100 |
| 28 | 10.67 | 1.67 | 0 | 100 |
| 29 | 9.65 | 1.6 | 0 | 100 |
| 30 | 8.73 | 1.53 | 0 | 100 |
| 31 | 7.89 | 1.45 | 0 | 100 |
| 32 | 7.12 | 1.38 | 0 | 100 |
| 33 | 6.42 | 1.31 | 0 | 100 |
| 34 | 5.79 | 1.24 | 0 | 100 |
| 35 | 5.22 | 1.17 | 0 | 100 |
| 36 | 4.7 | 1.1 | 0 | 100 |
| 37 | 4.23 | 1.03 | 0 | 100 |
| 38 | 3.81 | 0.97 | 0 | 100 |
| 39 | 3.42 | 0.91 | 0 | 100 |
| 40 | 3.08 | 0.85 | 0 | 100 |
| 41 | 2.77 | 0.79 | 0 | 100 |
| 42 | 2.49 | 0.74 | 0 | 100 |
| 43 | 2.24 | 0.68 | 0 | 100 |
| 44 | 2.01 | 0.64 | 0 | 100 |
| 45 | 1.8 | 0.59 | 0 | 100 |
| 46 | 1.62 | 0.55 | 0 | 100 |
| 47 | 1.46 | 0.51 | 0 | 100 |
| 48 | 1.31 | 0.47 | 0 | 100 |
| 49 | 1.17 | 0.43 | 0 | 100 |
| 50 | 1.05 | 0.4 | 0 | 100 |
| 51 | 0.95 | 0.37 | 0 | 100 |
| 52 | 0.85 | 0.34 | 0 | 100 |
| 53 | 0.76 | 0.32 | 0 | 100 |
| 54 | 0.69 | 0.29 | 0 | 100 |
| 55 | 0.62 | 0.27 | 0 | 100 |
| 56 | 0.55 | 0.25 | 0 | 100 |
| 57 | 0.5 | 0.23 | 0 | 100 |
| 58 | 0.45 | 0.21 | 0 | 100 |
| 59 | 0.4 | 0.19 | 0 | 100 |
| 60 | 0.36 | 0.18 | 0 | 100 |
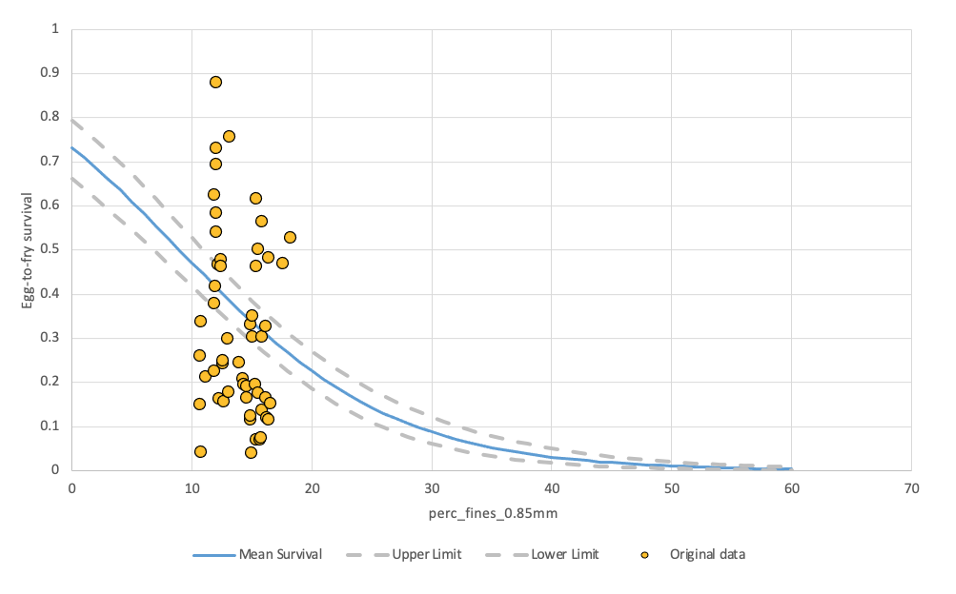
Stressor Response Chart
Mean Response
±1 Standard Deviation
Upper/Lower Limits