Flow and Plains Sucker System Capacity
mbakken
View all records in the stressor response library

Species Common Name
Plains Sucker
Latin Name (Genus species)
Pantosteus jordani
Stressor Name
Flow
Specific Stressor Metric
Mean annual discharge (MAD)
Stressor Units
% MAD
Vital Rate (Process)
Failure velocity
Geography
Saskatchewan
Detailed SR Function Description
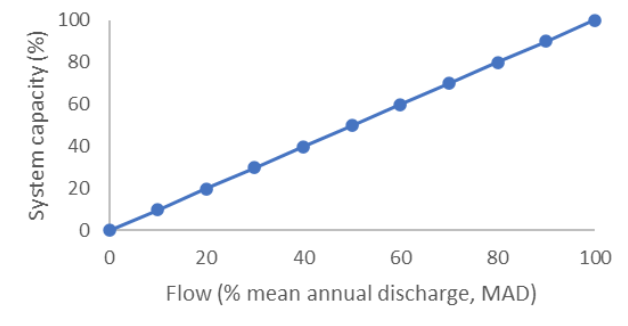
Flow is represented here as percent mean annual discharge (% MAD). Plains Sucker can persist in relatively high flow (e.g. Milk River during summer augmentation) and low flow environments (e.g. pools with little to no flow). It is expected that the full stressor-response function for flow will be unimodal in shape, where extremely high flow rates will likely negatively impact Plains Sucker. For example, failure velocity experiments on Plains Sucker showed that fish failed to hold their position at flow rates ranging from 0.08-1.05 m•s-1 (MacLeod 2023); however, Plains Sucker have been found in rivers with mean summer or autumn flow rates that range from 0.3-16.1 m3•s-1. In terms of field data, we have biomass (catch-per-unit-effort; CPUE) data for 6 sites within the Milk River drainage, along with water velocities for the site on sampling day (Teillet et al. 2021). If MAD is calculated using the mean of these values (n=6, MAD=0.14 m/s) and % system capacity is scaled such that 100% system capacity is the highest biomass estimate from these data, then % system capacity peaks at ~132% MAD. Without more reliable data on biomass or abundance, MAD, the energy expenditure of swimming or maintaining position under various flow conditions, or the full range of stream flow experienced by Plains Sucker we cannot estimate an upper threshold at this time.
Function Derivation
Expert opinion
Transferability of Function
This stressor-response function is suitable for use on Plains Sucker populations in the Saskatchewan-Nelson and Missouri River drainages in Southern Alberta and Saskatchewan; however, it should be noted that preliminary analyses of experimental data suggest that there may be differences in physiological tolerances to flow between the Milk River populations and other waterbodies because Milk River populations are subject to increased flows annually from April-October and may have adapted accordingly (MacLeod 2023). It may be reasonable to assume the SR function can be applied to Cordilleran Sucker, given the similarity of their physical characteristics (prior to 2023 both species were classified under a single species, Mountain Sucker); however, there is no data to confirm this assumption. It should also be noted that experimental data suggest that Plains Sucker could hold their position at higher flow rates than White Sucker and Longnose Sucker (two other catostomids in the Missouri River drainage; MacLeod 2023); however, only one study was conducted and energetic costs were not considered. Therefore, more data are required and caution should be taken when using this function on other species.
Source of stressor Data
MacLeod (2023) reported mean flow rates for the Milk River (mean augmented flow rate [April-September]: 16.06 m3⋅s-1; mean natural flow rate [October-March]: 2.36 m3⋅s-1) and Battle Creek (mean summer flow rate [April-September]: 0.46 m3⋅s-1 ; mean winter flow rate [October, February, and March]: 0.31 m3⋅s-1). These data were acquired from https://www.canada.ca/en/environment-climate-change/services/water-overview/quantity/monitoring/survey/data-products-services.html. Locations were reported as follows: Milk River (11AA005) 1917-2019, 01/01-31/12; Milk River at the Western Crossing of the International Boundary (11AA025) 1931-2019, 10/02-10/11; and Battle Creek at the Alberta Boundary (11AB117) 1975-2018, 01/02-19/11 (Water Office, 2019). Sampling-day water velocities were also reported for 6 sites within along the Milk River (Highway 501 Bridge, Highway 62 Bridge, Township Rd 24A, Coffin Bridge, Deer Creek Bridge, Pinhorn Ranch) in Teillet et al. 2021.
Function Type
continuous
Stressor Scale
linear
References Cited
Jarvis, L. 2022. Flow stressor-response function for Plains Sucker. Department of Fisheries and Oceans CEMPRA model for Plains Sucker.
McLeod M. 2023. Assessing the station holding ability of three benthic fishes exposed to flow augmentation: Implications for a species at risk. M.Sc., Department of Renewable Resources, University of Alberta, Alberta, Canada.
Teillet, M., Watkinson, D.A., Petry, S.F., and Enders, E.C. 2021. Report on Plains Sucker (Pantosteus jordani), Rocky Mountain Sculpin (Cottus sp.), Western Silvery Minnow (Hybognathus argyritis), and Stonecat (Noturus flavus) sampling conducted in 2020 in the Milk River drainage, Alberta. Can. Data Rep. Fish. Aquat. Sci. 1330: vi + 13 p.
File Upload
Plains Sucker - Flow CEMPRA SR Function
(781.18 KB)
Images
Stressor Response csv data
Data_PLSU_Flow.csv
(396 bytes)
| Flow (% MAD) | Mean System Capacity (%) | SD | low.limit | up.limit | |
|---|---|---|---|---|---|
| 100 | 100 | 0 | 0 | 100 | |
| 90 | 90 | 0 | 0 | 100 | |
| 80 | 80 | 0 | 0 | 100 | |
| 70 | 70 | 0 | 0 | 100 | |
| 60 | 60 | 0 | 0 | 100 | |
| 50 | 50 | 0 | 0 | 100 | |
| 40 | 40 | 0 | 0 | 100 | |
| 30 | 30 | 0 | 0 | 100 | |
| 20 | 20 | 0 | 0 | 100 | |
| 10 | 10 | 0 | 0 | 100 | |
| 0 | 0 | 0 | 0 | 100 | |
| LEFT OFF NEEDING TO FIGURE OUT HOW/IF I SHOULD USE THE FIELD/EXPERIMENTAL DATA TO INFORM FINAL SR |
Stressor Response Chart
Mean Response
±1 Standard Deviation
Upper/Lower Limits